
FIGURE 1.
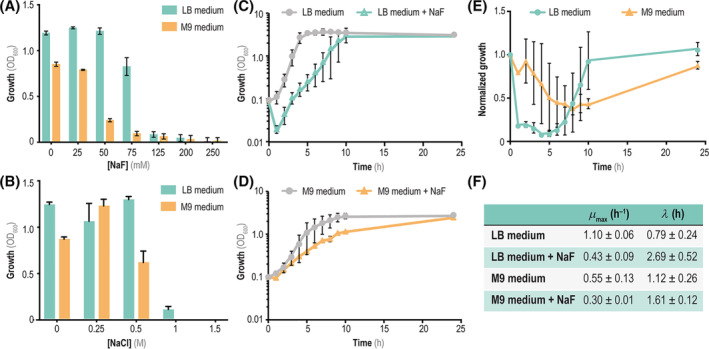
Impact of mineral F− on growth profiles of P. putida KT2440. (A) Minimal inhibitory concentration (MIC) assays with different NaF concentrations added to either LB medium (green) or M9 minimal medium containing 5 g L−1 glucose as the only carbon source (orange). Growth was estimated as the optical density measured at 600 nm (OD600) after 20 h of incubation. (B) MIC assays carried out by adding NaCl to the culture media instead of NaF. (C) Growth curves of P. putida KT2440 in shaken‐flask cultures in LB medium (grey circles) or LB medium supplemented with 50 mM NaF (green triangles). (D) Time‐course growth curves in Erlenmeyer flasks of P. putida KT2440 in M9 minimal medium (grey circles) and M9 supplemented with 50 mM of NaF (orange triangles). In all cases, 5 g L−1 glucose was added as the only carbon source. (E) Tolerance of P. putida KT2440 to F− in both rich and defined culture media. Time‐resolved tolerance curves represent the ratio between the bacterial growth (estimated as the OD600) in the presence of 50 mM NaF and the growth in the control condition in LB medium (green circles) and M9 minimal medium containing 5 g L−1 glucose (orange triangles). (F) Quantitative physiology parameters (maximum specific growth rate, μ max and duration of the lag phase, λ) for cultures of P. putida KT2440 in LB medium or M9 minimal medium containing 5 g L−1 glucose, supplemented or not with 50 mM NaF. In all cases, the error bars represent standard deviations of average values calculated from at least three independent experiments. Abbreviation: LB, lysogeny broth