
FIGURE 3.
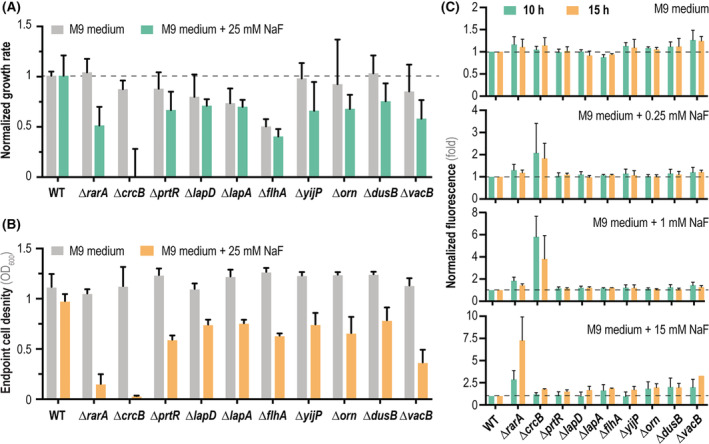
Phenotypic characterization of individual P. putida mutants in genes identified by the Tn‐Seq screening. (A) Normalized growth rates of mutant strains compared to wild‐type P. putida KT2440 (WT) grown either under control conditions (M9 minimal medium containing 5 g L−1 glucose as the only carbon source, grey bars) or stressful conditions (+25 mM NaF, green bars). Dashed lines indicate a growth rate identical to that of the WT strain. (B) Final cell density (estimated as the optical density measured at 600 nm, OD600) of the WT strain and the individual P. putida mutants after 15 h of incubation (i.e. onset of the stationary phase) under control conditions (M9 minimal medium containing 5 g L−1 glucose, grey bars) and stressful conditions (+25 mM NaF, orange bars). (C) Intracellular F− concentration estimated with a biosensor based on the fluoride‐sensitive riboswitch (FRS), which couples the presence of F− with a fluorescent (msfGFP) output. Normalized msfGFP fluorescence (indicated as the fold change) of the individual P. putida mutants carrying the FRS biosensor compared to the WT strain incubated in the presence of different NaF concentrations (0, 0.25, 1 and 15 mM). Measurements were done after 10 or 15 h of incubation, and the dashed line indicates fluorescence levels within the range of the WT strain. In all cases, error bars represent standard deviations of average values calculated from at least three independent biological replicates