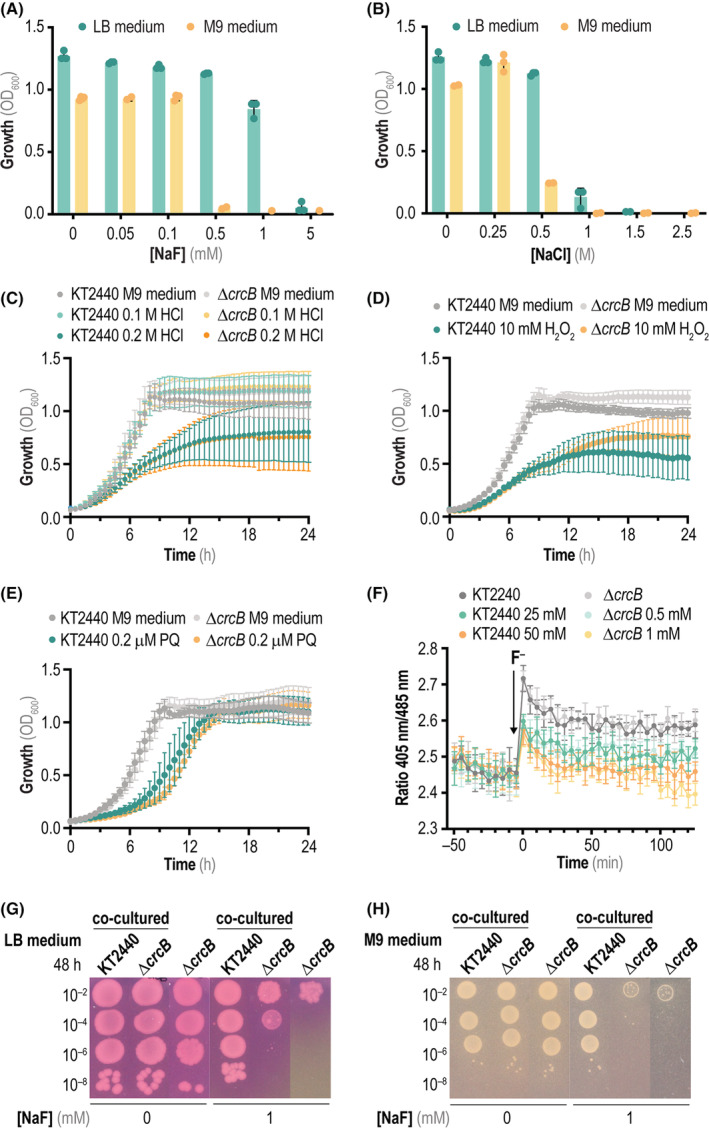
FIGURE 4.

Physiological characterization of P. putida ΔcrcB in the presence of mineral F−. (A) Minimal inhibitory concentration (MIC) assay of P. putida ΔcrcB exposed to increasing NaF concentrations after 20 h of incubation in either LB medium or M9 minimal medium containing 5 g L−1 glucose as the only carbon source. Growth was estimated as the optical density measured at 600 nm (OD600); dots represent individual data per experiment with at least three independent cultures analysed per condition. (B) Same as in panel (A) but applying increasing NaCl concentrations. (C) Growth curves of wild‐type P. putida KT2440 and P. putida ΔcrcB in M9 minimal medium added with 5 g L−1 glucose as the only carbon source and HCl at different concentrations. (D) and (E) Same as in panel (C), but in this case cells were cultured in M9 minimal medium (containing 5 g L−1 glucose) added with either H2O2 or paraquat (PQ, N,N′‐dimethyl‐4,4′‐bipyridinium dichloride), respectively. In all cases, error bars represent standard deviations of average values calculated from at least three independent biological replicates. (F) Changes in the intracellular pH of P. putida KT2440 and P. putida ΔcrcB using a ratiometric, non‐invasive pH biosensor (PHP). Cells were grown in M9 minimal medium containing 5 g L−1 glucose as the only carbon source, and the intracellular pH was followed over 2 h upon addition of NaF (black arrow, at t = 0 min) by plotting the fluorescence ratio 405 nm/485 nm over time. The error bars represent standard deviations of at least four technical replicates, and a representative experiment out of three independent biological replicates is shown. (G) Survival drop assays of P. putida KT2440 and P. putida ΔcrcB in LB medium plates in the presence of the pH indicator phenol red. In some experiments, the culture medium was added with 1 mM NaF, and the plates were incubated for 48 h at 30°C. Co‐cultured strains indicate drops of the wild‐type and mutant strains that were incubated next to each other in the same plate. (H) Same as in panel (G), but the experiment was carried out in M9 minimal medium plates containing 5 g L−1 glucose as the only carbon source. Abbreviation: LB, lysogeny broth
