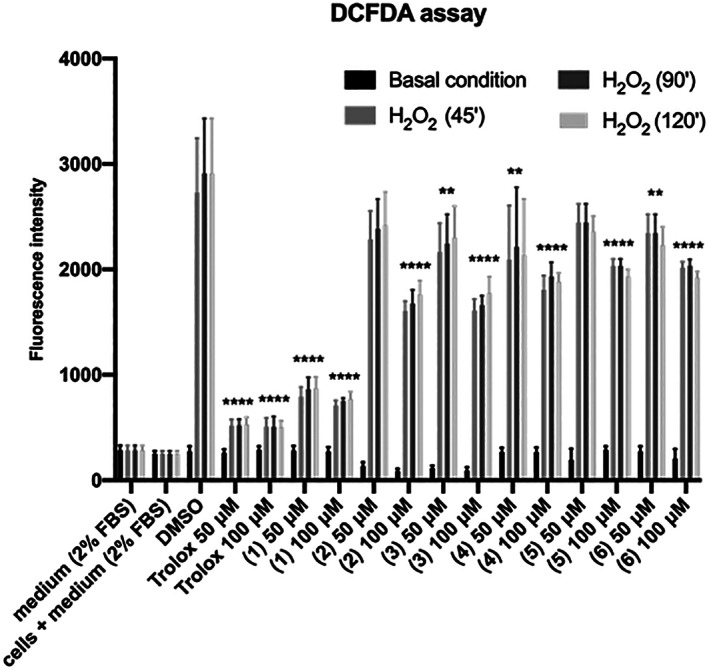
FIGURE 3.

DCFDA assay. HaCaT cells were seeded and pre‐treated for 4 h with 50 and 100 μM 1‐6 metabolites from C. phelypaea. H2O2 (1 mM; 3%) was added to the medium for 45′, 1.5, and 2h. The fluorescence intensity of DCFDA was read after 45′ of incubation. Trolox was used as a positive control and DMSO, in which the metabolites are dissolved, as a negative control. The values are the mean’s six values for each experimental point of two independent biological replicates. Statistical analysis was performed with two‐way ANOVA, using Tukey’s multiple comparison test. Levels of significance between points of expression are indicated (****p < 0.001, ***p < 0.01, **p < 0.05)
