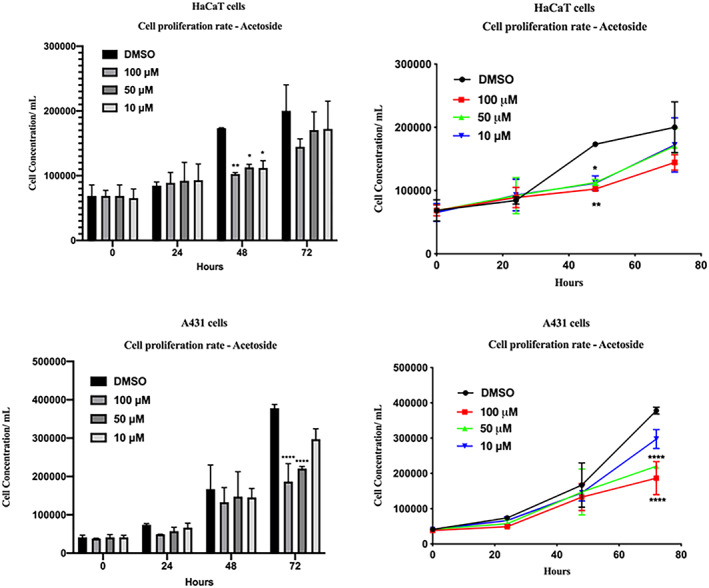
FIGURE 4.

Cell proliferation rate. Hacat and A431 cells were seeded and treated with acetoside (1) 10, 50, 100 μM. Cells were counted with Scepter at T0, 24, 48, 72 h of treatments. Results are the mean ± SEM of three independent biological experiments relative to the experimental control (DMSO). Statistical analysis was performed with one‐way ANOVA, using Dunnett’s multiple comparison test. Levels of significance between points of expression are indicated (****p < 0.001, **p < 0.01)
