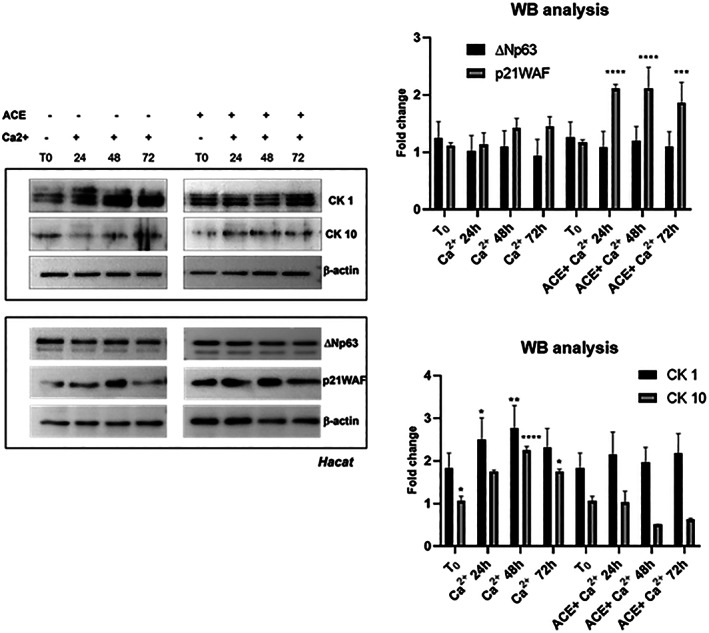
FIGURE 6.

Representative western blot analysis of a total extract from Hacat keratinocytes in response to Ca2+ addition in the presence or absence of acetoside. Hacat cells were differentiated with 2 mM Ca2+ and compared with cells treated with Ca2+ plus 50 μM acetoside (ACE) for 48 and 72 h. (a) Immunoblot was probed with ΔNp63α, p21WAF, CK1 and CK10 antibodies. β‐Actin was used as a loading control. (b) The signals of protein bands were quantified by ImageLab software version 4.1 (Bio‐Rad) Statistical analyses were performed using 2‐way ANOVA and Sidak’s multiple comparisons or Dunnett’s multiple comparisons test. Levels of significance between points of expression are indicated (***p < 0.001, **p < 0.01, *p < 0.05)
