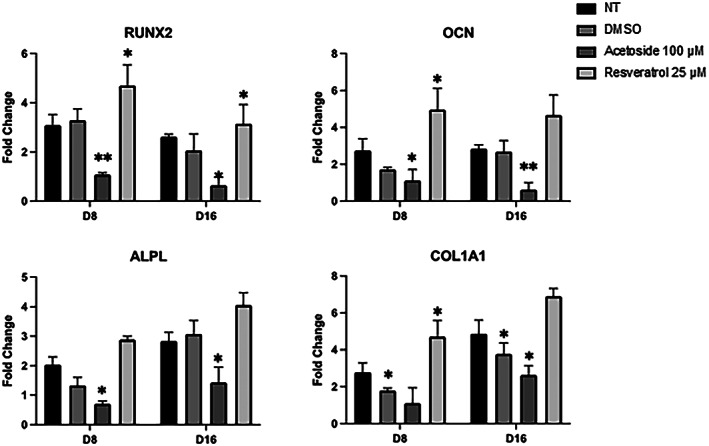
FIGURE 7.

RT‐qPCR analysis of the osteogenic markers (COL1A1, RUNX2, OCN and ALPL). The mRNA levels were normalized to Gapdh expression and reported as fold change to the value in D0. Resveratrol was used as a positive control of differentiation. The values shown are mean ± SD, based on triplicate assays. Statistical analyses were performed using Student’s t‐test, where p < 0.05 was considered significant (*p < 0.05, **p < 0.01)
