FIGURE 2.

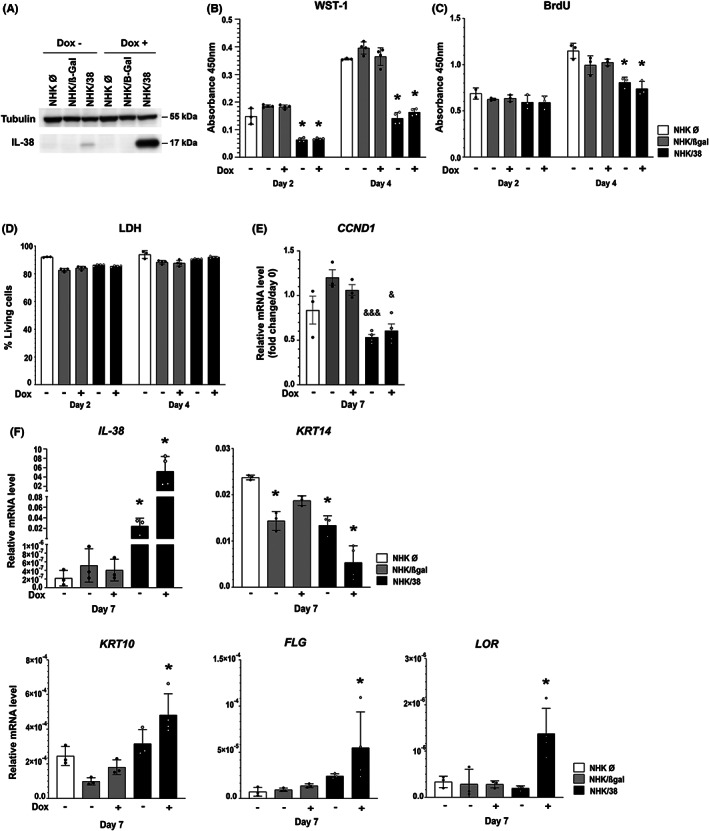
Effects of IL‐38 overexpression on NHK cells. (A) Western blot analysis of IL‐38 protein expression in empty vector transfected NHK cells (NHK Ø), and in NHK/β‐Gal and NHK/38 cells without and with Dox induction for 24 h. Tubulin levels are shown as a loading control. (B) Metabolic activity, assessed by WST‐1 colorimetric assay, in NHK Ø, NHK/β‐Gal and NHK/38 cells cultured for 2 and 4 days after induction without or with Dox. Data are means ± SEM (n = 3–4). (C) Cell proliferation assessed by BrdU assay in NHK Ø, NHK/β‐Gal and NHK/38 cells cultured for 2 and 4 days after induction without or with Dox. Data are means ± SEM (n = 3). (D) Cell viability, assessed by measuring lactate dehydrogenase (LDH) activity in supernatants of NHK Ø, NHK/β‐Gal and NHK/38 cells incubated during 2, 4 or 6 days after induction without or with Dox. Results are shown as the percentage of living cells. Data are means ± SEM (n = 3–4). (E) Fold change in CCND1 mRNA levels, normalized to 18S rRNA, relative to day 0, assessed by RTqPCR in NHK Ø, NHK/β‐Gal and NHK/38 cells differentiated for 7 days after induction without or with Dox. Data are means ± SEM (n = 3–4). (F) IL‐38, KRT14, KRT10, FLG and LOR mRNA levels, relative to 18S rRNA, assessed by RTqPCR in NHK Ø, NHK/β‐Gal and NHK/38 cells differentiated for 7 days after induction without or with Dox. Data are means ± SEM (n = 3–5). Data are (B‐D) technical triplicates or technical duplicates of biological duplicates, or (E, F) biological replicates. *p < 0.05 as compared to NHK Ø cells, & p < 0.05, &&& p < 0.001 as compared to NHK/β‐Gal cells, p values were calculated using a two‐way ANOVA with Tukey's multiple comparison.
