
FIGURE 3.
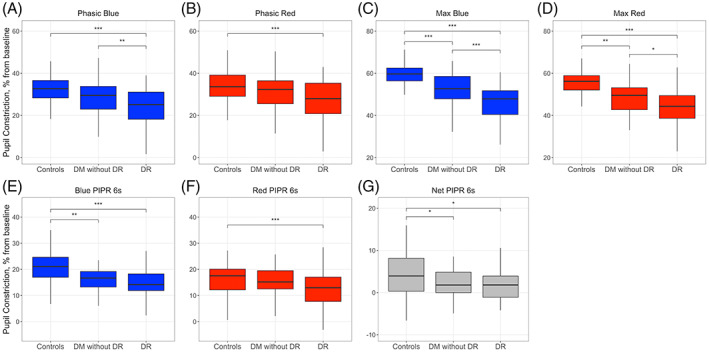
Pupillometric parameters in controls and patients with diabetes, with and without diabetic retinopathy. Differences between groups in phasic (A, B) and maximal pupillary constriction amplitudes (C, D), PIPR 6s (E, F), and Net PIPR 6s (G), in response to the blue (469 nm) and red (640 nm) light stimuli. DM, diabetes mellitus; DR, diabetic retinopathy. Difference between groups is indicated as * for p < 0.05, ** for p < 0.01, and *** for p < 0.001.