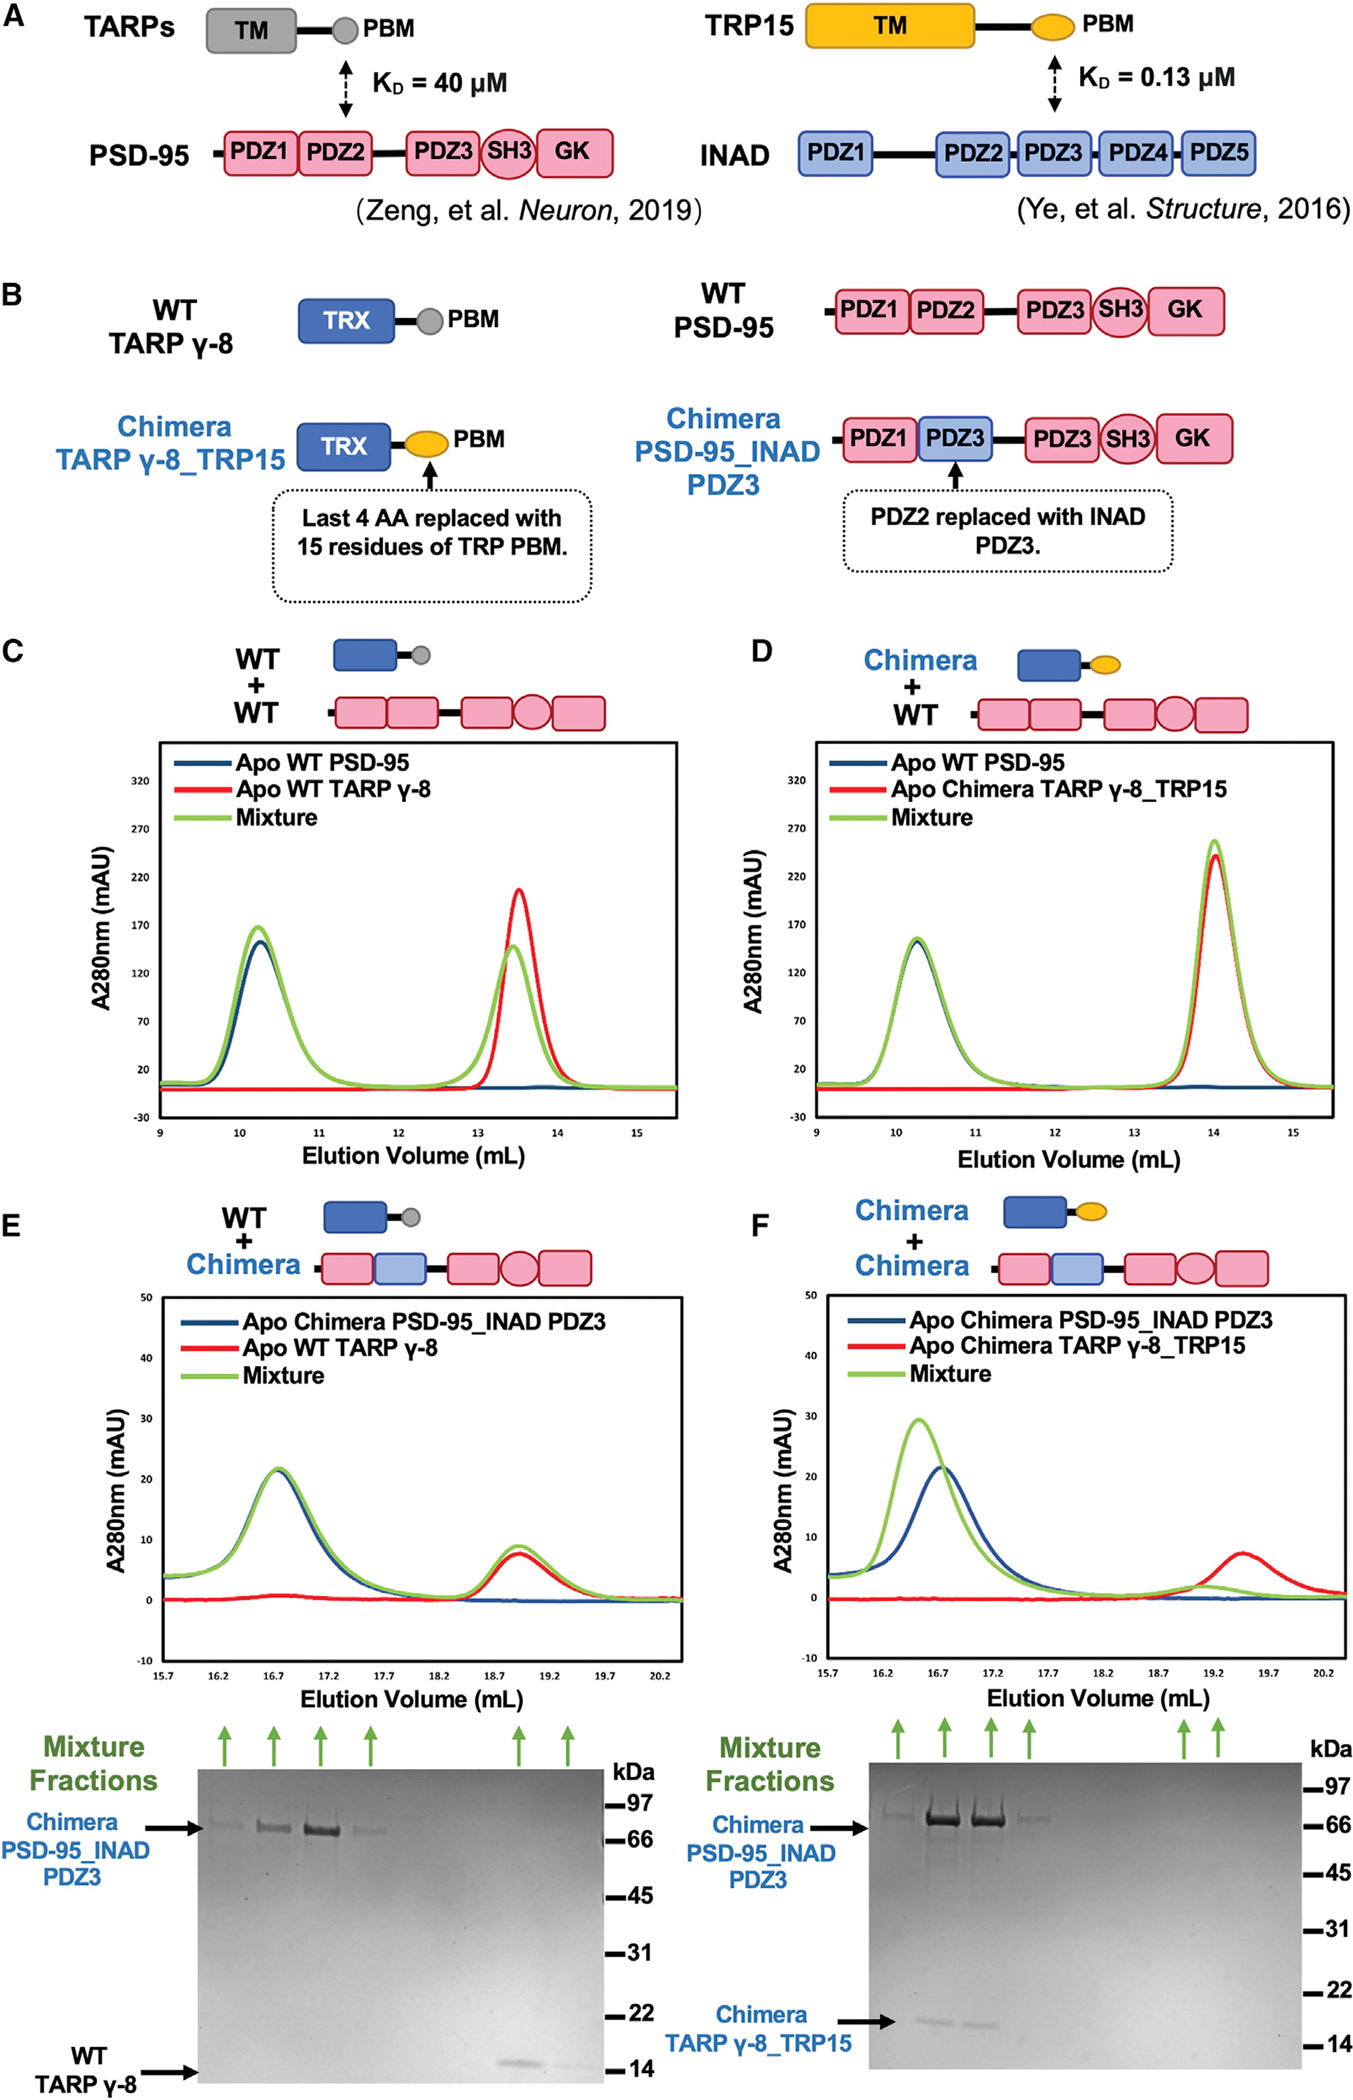
Figure 1. Protein designs for in vitro biochemical reconstitution.

(A) Schematic diagram showing two reported protein interacting pairs mediated by specific PDZ-PBM interaction. Left: TARP PBM weakly binds to PDZ2 of PSD-95 with KD ~40 μM (Zeng et al., 2019). Right: Drosophila TRP PBM interacts with PDZ3 of INAD with KD ~0.13 μM (Ye et al, 2016).
(B) Detailed protein designs for in vitro biochemical reconstitution. Last 15 aa from mouse TARP γ-8 were fused to the C terminus of thioredoxin (TRX) to make “WT TARP γ-8.” A TARP γ-8 chimera was constructed by replacing the last 4 aa of WT TARP γ-8 with the last 20 aa of TRP to generate “chimera TARP γ-8_TRP15.” WT PSD-95 is composed of aa 61–724 of human PSD-95. A PSD-95 chimera was designed by replacing its PDZ2 with PDZ3 of INAD and termed as “PSD-95_INAD PDZ3.”
(C) Analytical gel filtration chromatography showing that WT PSD-95 weakly interacts with WT TARP γ-8. 150 μM WT TARP γ-8 (colored in red), 50 μM WT PSD-95 (colored in blue), and their mixture (colored in green) were loaded onto a Superose 12 column (GE) with 100 μL injection volume.
(D) Analytical gel filtration chromatography showing undetectable interaction between WT PSD-95 and chimera TARP γ-8_TRP15. 150 μM TARP γ-8_TRP15 (colored in red), 50 μM WT PSD-95 (colored in blue), and their mixture (colored in green) were loaded onto a Superose 12 column (GE) with 100 μL injection volume.
(E) Analytical gel filtration chromatography (top panel) and SDS-PAGE with Coomassie blue staining analysis (bottom panel) showing no interaction between chimera PSD-95_INAD PDZ3 and WT TARP γ-8. 5 μM WT TARP γ-8 (colored in red), 5 μM PSD-95_INAD PDZ3 (colored in blue), and their mixture (colored in green) were loaded onto a Superose 6 column (GE) with 100 μL injection volume. For SDS-PAGE, 300 μL protein samples from each indicated fraction were first precipitated with acetone and then resolved with 20 μL 2X SDS loading buffer. Molecular weights are marked on the right side of the SDS-PAGE gel image.
(F) Analytical gel filtration chromatography (top panel) and SDS-PAGE with Coomassie blue staining analysis (bottom panel) showing strong interaction between chimera PSD-95_INAD PDZ3 and chimera TARP γ-8_TRP15, indicated by co-elution of the two proteins in a single complex peak. 5 μM TARP γ-8_TRP15 (colored in red), 5 μM PSD-95_INAD PDZ3 (colored in blue), and their mixture (colored in green) were loaded onto a Superose 6 column (GE) with 100 μL injection volume. For SDS-PAGE, 300 μL protein samples from each indicated fraction were first precipitated with acetone and then resolved with 20 μL 2× SDS loading buffer. Molecular weights are marked on the right side of the SDS-PAGE gel image.
Experiments shown in (C)–(F) have been performed at least three times, and the results are repeatable.
