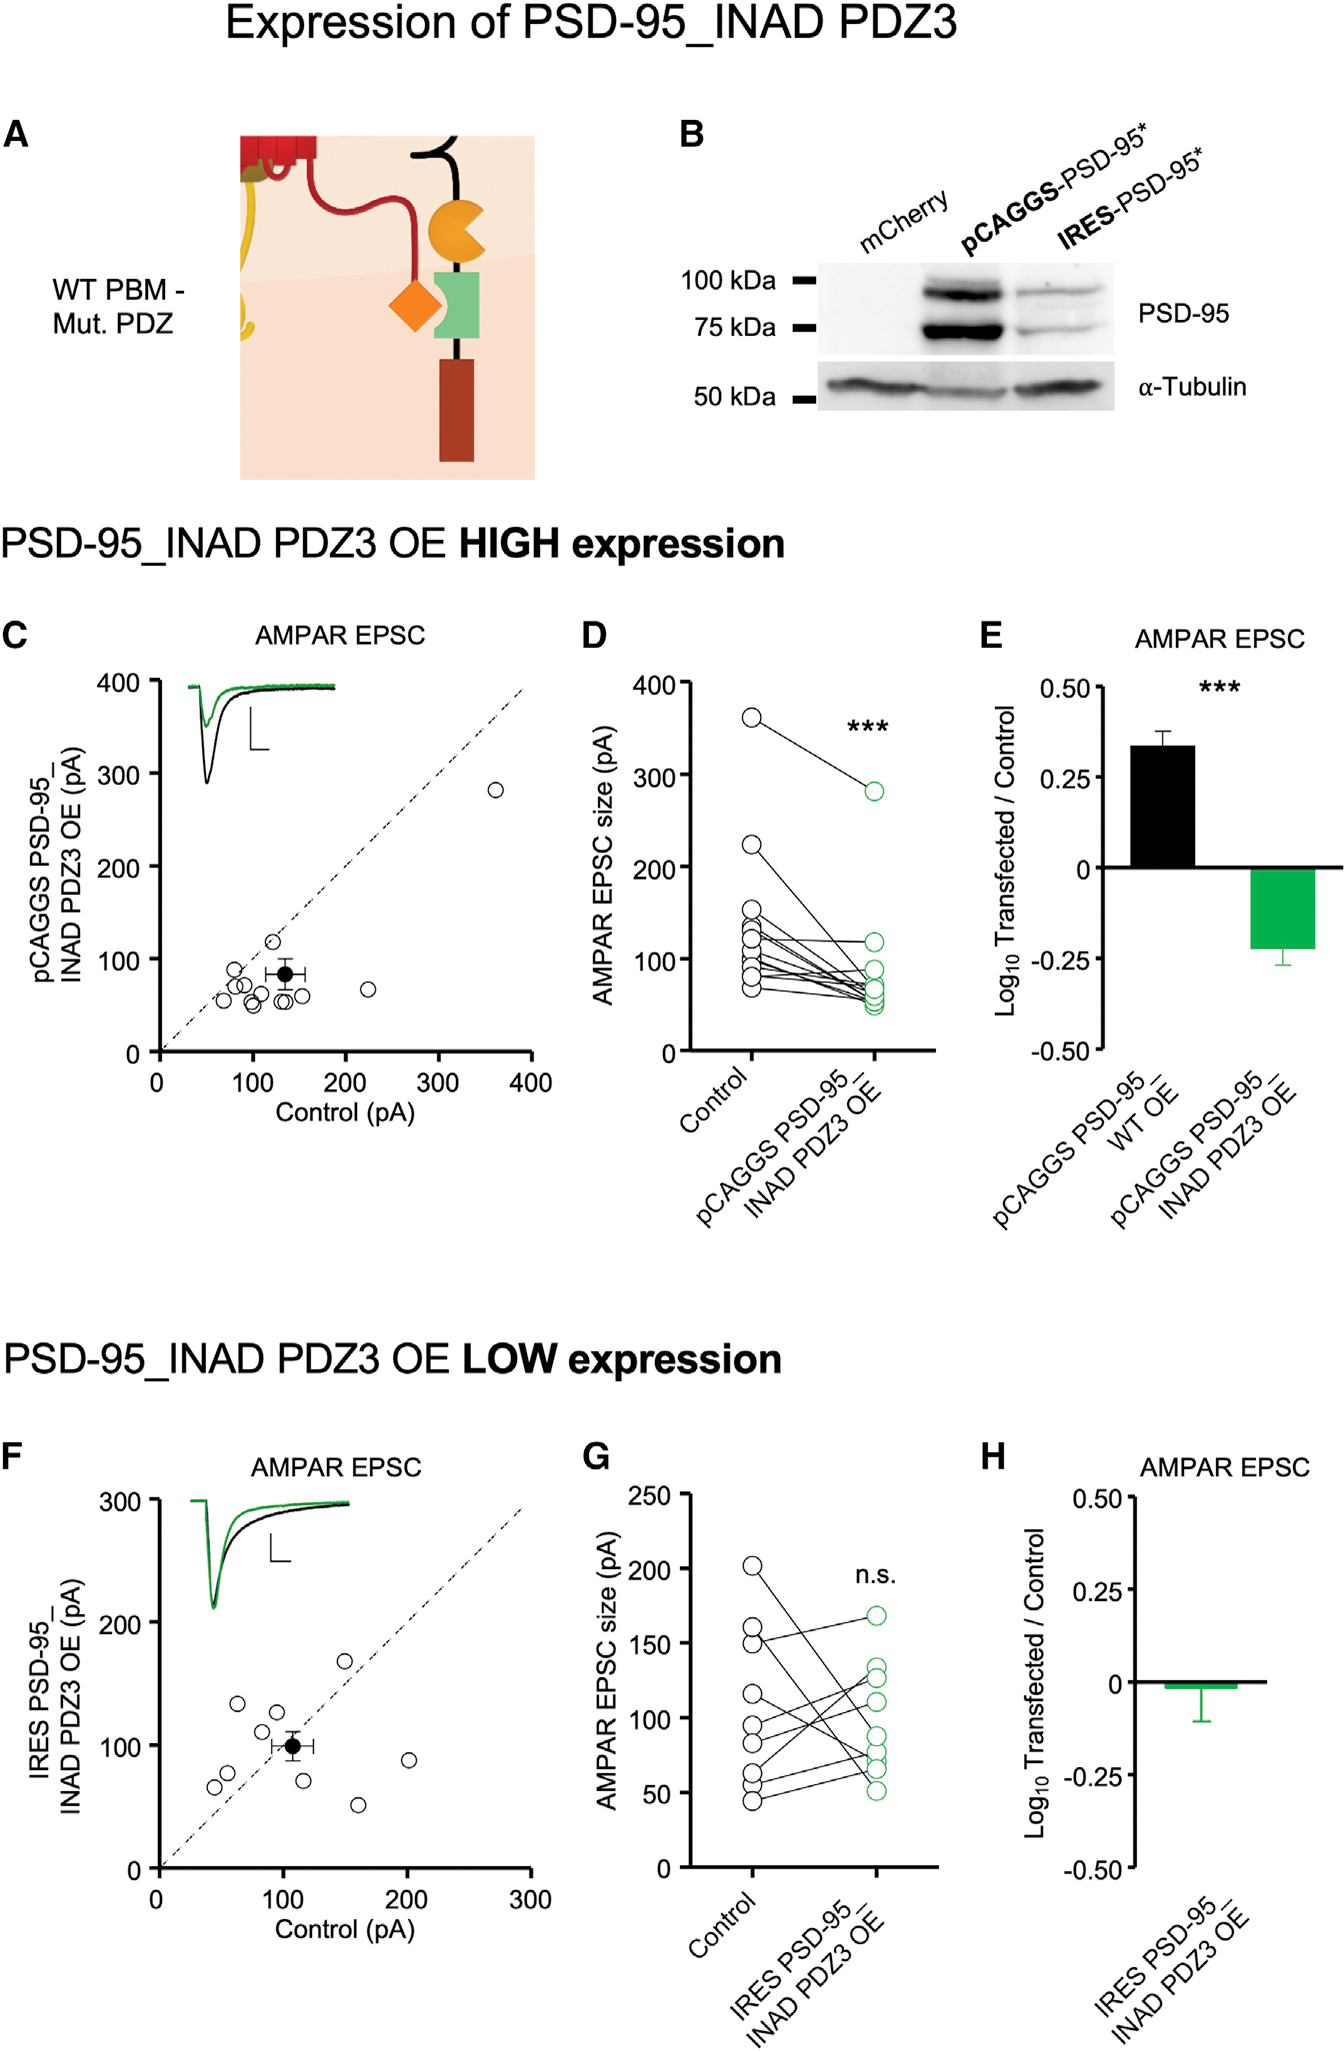
Figure 3. Effect of overexpressing PSD-95_INAD PDZ3 on AMPAR synaptic transmission.

(A) Schematic of the failed mutant PDZ interaction with the WT PBM in PSD-95_INAD PDZ3-expressing neurons.
(B) PSD-95_INAD PDZ3 expression driven by a pCAGGS promoter is stronger than by an IRES promoter. Western blot images show 293T cell lysates stained for PSD-95 expression after 18 h of transfection. From left to right, cells were transfected with pCAGGS mCherry, pCAGGS-PSD-95_INAD PDZ3, and IRES PSD-95_INAD PDZ3. Alpha-tubulin is used as loading control. The absence of PSD-95 signal in the mCherry western blot validates antibody specificity. Each of the double bands may represent different PSD-95 cleavage products, such as before and after endoplasmic reticulum (ER) processing. n = 3 biological replicates.
(C) Simultaneous dual whole-cell recordings were made from a transfected CA1 pyramidal neuron (green trace) and a neighboring WT one (black trace). Overexpression of pCAGGS PSD-95_INAD PDZ3 reduces AMPAR EPSC size. Scatterplots showing amplitudes of AMPAR EPSCs for single pairs (open circles) and mean ± SEM (filled circle) of control and pCAGGS PSD-95_INAD PDZ3 overexpression neurons. Insets show representative EPSC traces. n = 13 paired recordings (scale bars, 50 pA and 20 ms).
(D) Dot plots showing amplitudes of AMPAR EPSCs for single pairs of control (black) and pCAGGS PSD-95_INAD PDZ3 (green) overexpression neurons. Same data as in (C).
(E) Overexpression of wild-type PSD-95 potentiates synaptic AMPAR transmission 2.5-fold (n = 11 pairs, reproduced for comparison from Fukata et al. [2021]), but overexpression of pCAGGS PSD-95_INAD PDZ3 (n = 13 paired recordings) depresses synaptic AMPAR transmission. Bar graphs showing the mean log10 transfected/control EPSC ratio ± SEM.
(F) Overexpression of IRES PSD-95_INAD PDZ3, which lowers the expression level relative to pCAGGS PSD-95_INAD PDZ3, does not affect EPSC size. Scatterplots showing amplitudes of AMPAR EPSCs for single pairs (open circles) and mean ± SEM (filled circle) of control (black trace) and IRES PSD-95_INAD PDZ3 (green trace) overexpression neurons. n = 9 paired recordings (scale bars, 50 pA and 20 ms).
(G) Dot plots showing amplitudes of AMPAR EPSCs for single pairs of control (black) and IRES PSD-95_INAD PDZ3 (green) neurons. Same data as (F).
(H) Overexpression of IRES PSD-95_INAD PDZ3 does not affect synaptic transmission. Bar graph showing the mean log10 transfected/control EPSC ratio ± SEM (n = 9 paired recordings). Data obtained from at least 3–4 mice per condition.
Statistical significance was analyzed using the Wilcoxon signed-rank test in (D) and (G). Unpaired t test with Welch’s correction was used to compare groups in (E). ***p < 0.001; n.s., not significant.
