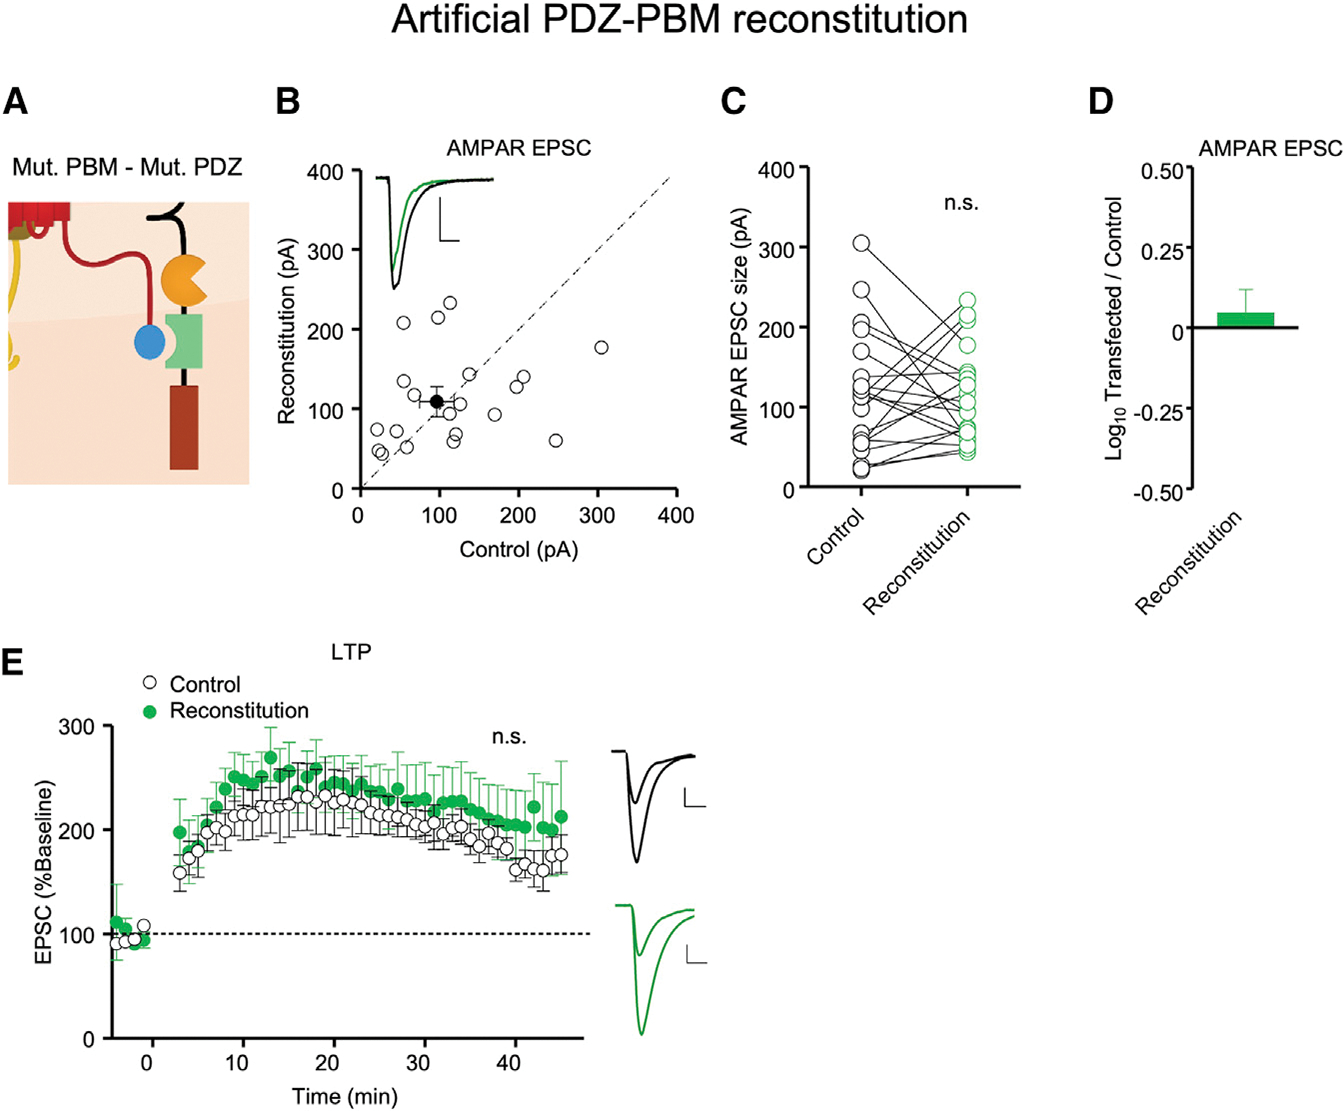
Figure 4. Co-expression of GluA1-TARP γ-8_TRP15 and PSD-95_INAD PDZ3 in AMPAR-null neurons reconstitutes synaptic AMPAR transmission and LTP.

Neurons in Gria1–3fl/fl mice were co-transfected with Cre, GluA1-TARP γ-8_TRP15, and IRES PSD-95_INAD PDZ3.
(A) Schematic of the artificial PDZ-PBM reconstitution in AMPAR-null neurons co-expressing GluA1-TARP γ-8_TRP15 and PSD-95_INAD PDZ3.
(B) Simultaneous dual whole-cell recordings were made from a transfected CA1 pyramidal neuron (green trace) and a neighboring WT one (black trace). Scatterplots showing amplitudes of AMPAR EPSCs for single pairs (open circles) and mean ± SEM (filled circle) of control and Cre + GluA1-TARP γ-8_TRP15 + IRES PSD-95_INAD PDZ3 (reconstitution) transfected neurons. n = 20 recorded pairs (scale bars, 50 pA and 20 ms).
(C) Dot plots showing amplitudes of AMPAR EPSCs for single pairs of control (black) and reconstitution (green) neurons. Same data as in (B).
(D) Co-transfection of Cre, GluA1-TARP γ-8_TRP15, and IRES PSD-95_INAD PDZ3 in Gria1–3fl/fl neurons rescues AMPAR EPSCs. Bar graph showing the mean log10 transfected/control EPSC ratio ± SEM. n = 20 recorded pairs.
(E) Dual whole-cell paired LTP recordings were performed from a control CA1 neuron and a neighboring cell expressing Cre + GluA1-TARP γ-8_TRP15 + IRES PSD-95_INAD PDZ3 in P16–P30 Gria1–3fl/fl acute slices. Plots showing mean ± SEM. AMPAR EPSC amplitude of control (open circle) and transfected (green circle) CA1 pyramidal neurons normalized to the mean AMPAR EPSC amplitude before LTP induction (minute 0). Insets show sample current traces before and 40 min after LTP induction from control (black trace) and transfected (green trace) neurons. n = 12 control neurons, n = 9 transfected neurons. Scale bars: 50 pA, 20 ms. Data obtained from at least 3–4 mice per condition. Statistical significance was analyzed using the Wilcoxon signed-rank test in (C). Normalized EPSC amplitudes at 40 min were compared using an unpaired t test with Welch’s correction in (E). n.s., not significant.
