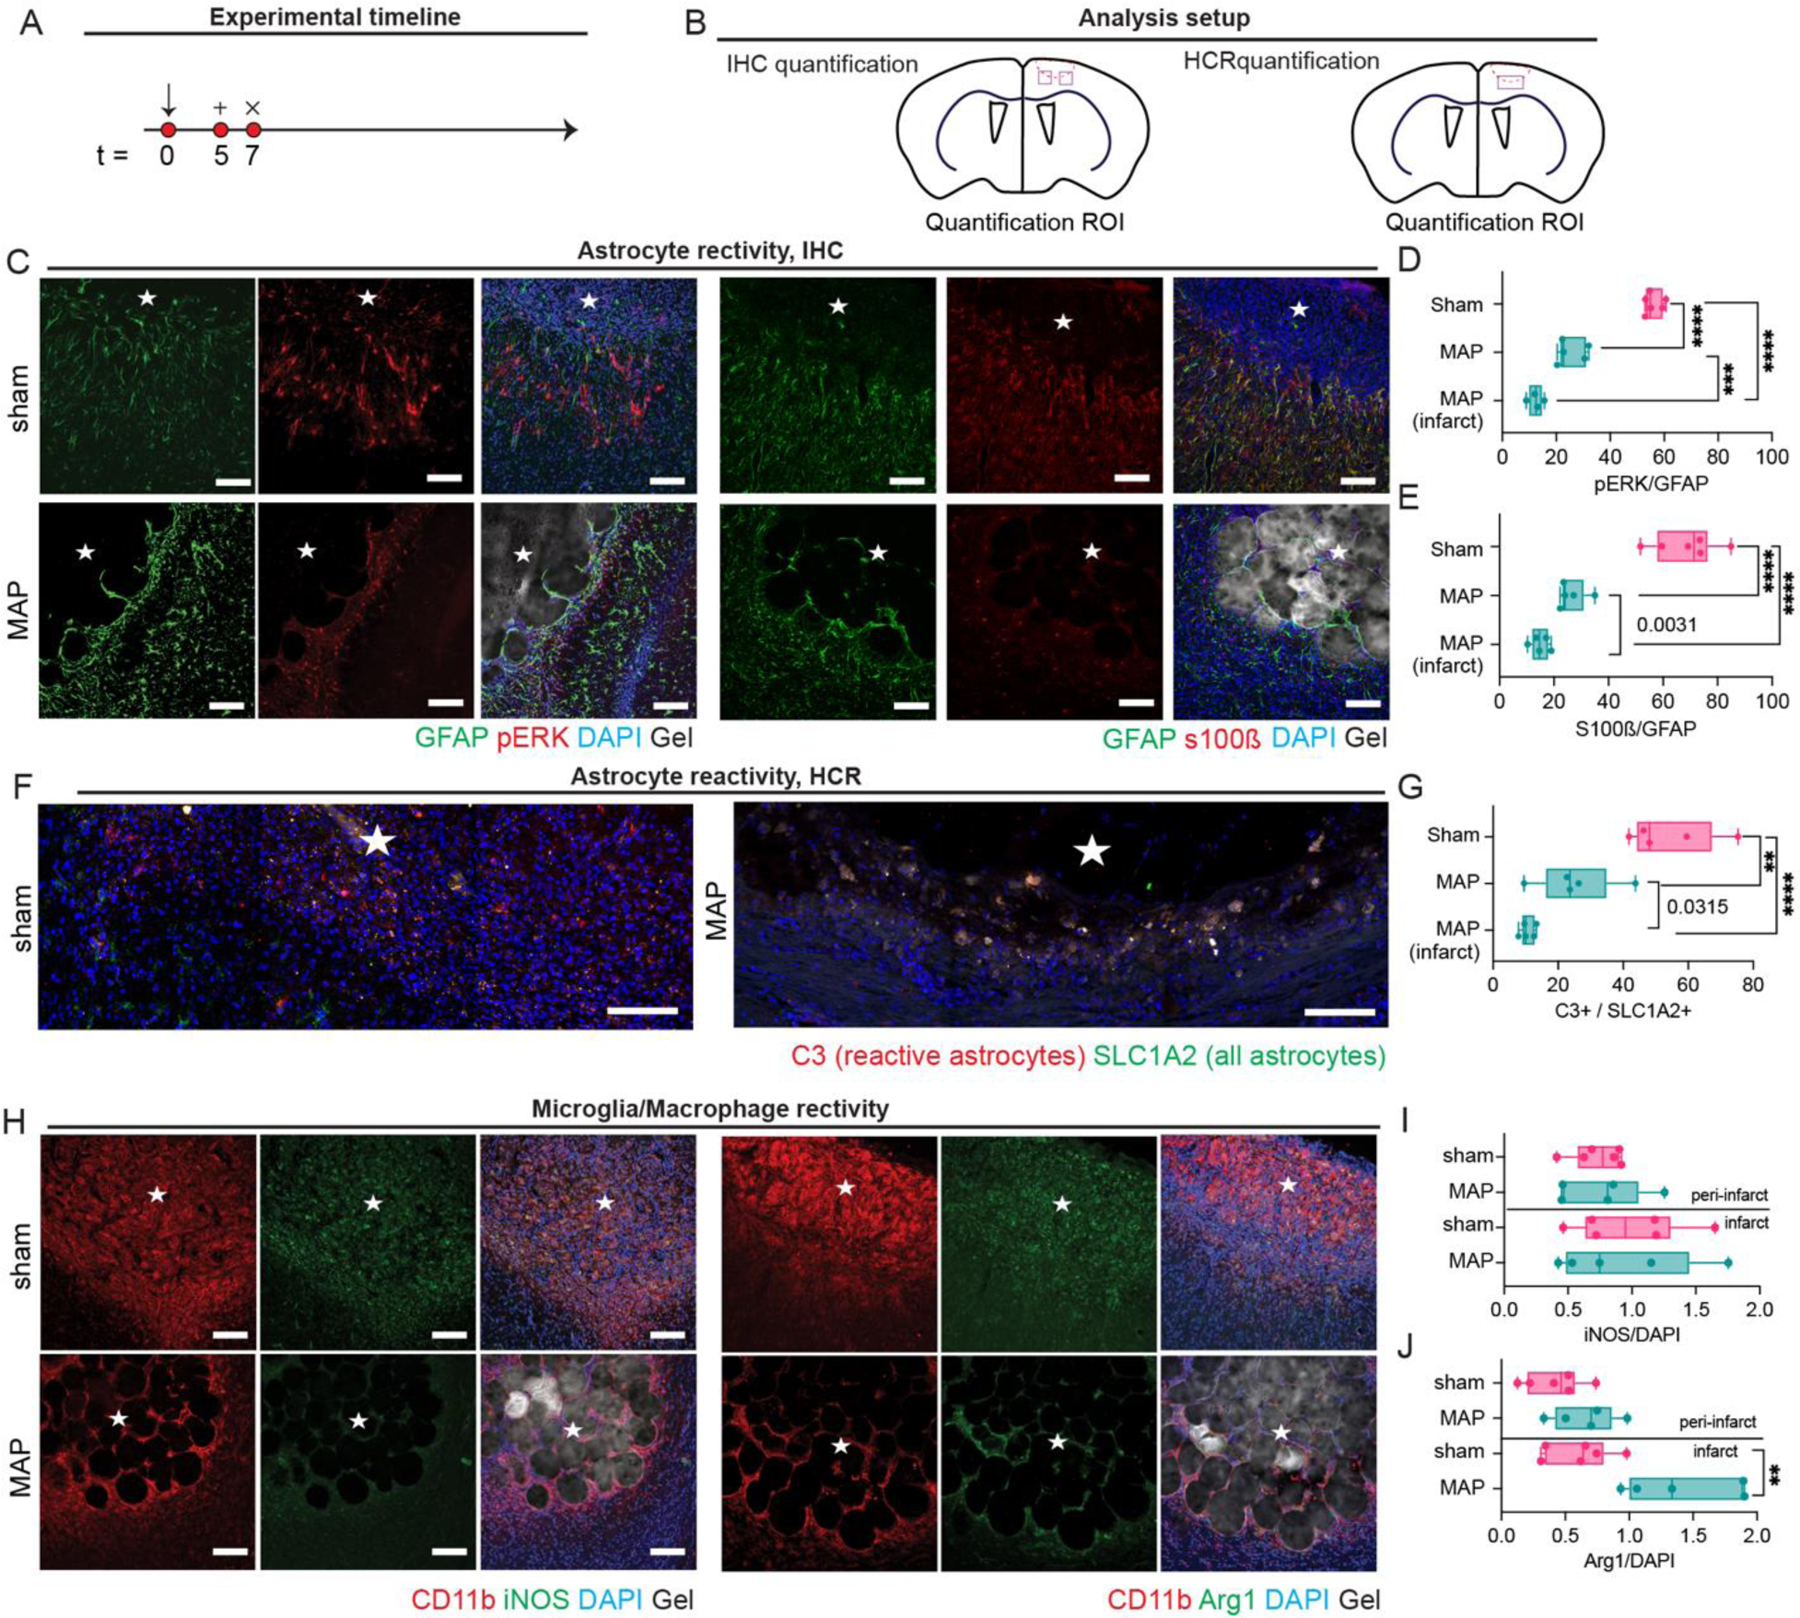
Figure 3.

A. Schematic of experimental timeline where arrow signifies stroke day, + signifies injection day (MAP only), and x signifies sacrifice and analysis time point. Sham is stroke only with no injection. B. Schematic of analysis setup showing where sections were imaged and analyzed. C. IHC images showing astrocyte reactivity through pERK, S100β, GFAP. D. Quantification of pERK/GFAP percent of astrocytes that are highly reactive. E. Quantification of S100β/GFAP percent of astrocytes that are highly reactive. F. In situ hybridization images of astrocyte reactivity through C3 and SLC1A2 probing. G. Quantification of C3/SLC1A2 percent of astrocytes that are highly reactive. H. IHC images of microglia reactivity through CD11b, Arg1, and iNOS staining. I. Quantification of iNOS/DAPI for determination of microglial pro-inflammatory phenotype. J. Quantification of Arg1/DAPI for determination of microglial pro-repair phenotype. All scale bar = 100µm. All measurements were done on FIJI. Statistical analysis was done in GraphPad Prism using one-way ANOVA analysis of variance followed by a multiple comparisons test comparing each condition (Tukey). The dots in each plot indicate the number of animals (n = 5 biological replicates) that were analyzed per-group and were considered independent experiments. *, **, ***, **** means p < 0.05, 0.01, 0.001, 0.0001. Individual p-values in G indicate t-test between the condition indicated. ☆ represents the stroke cavity.
