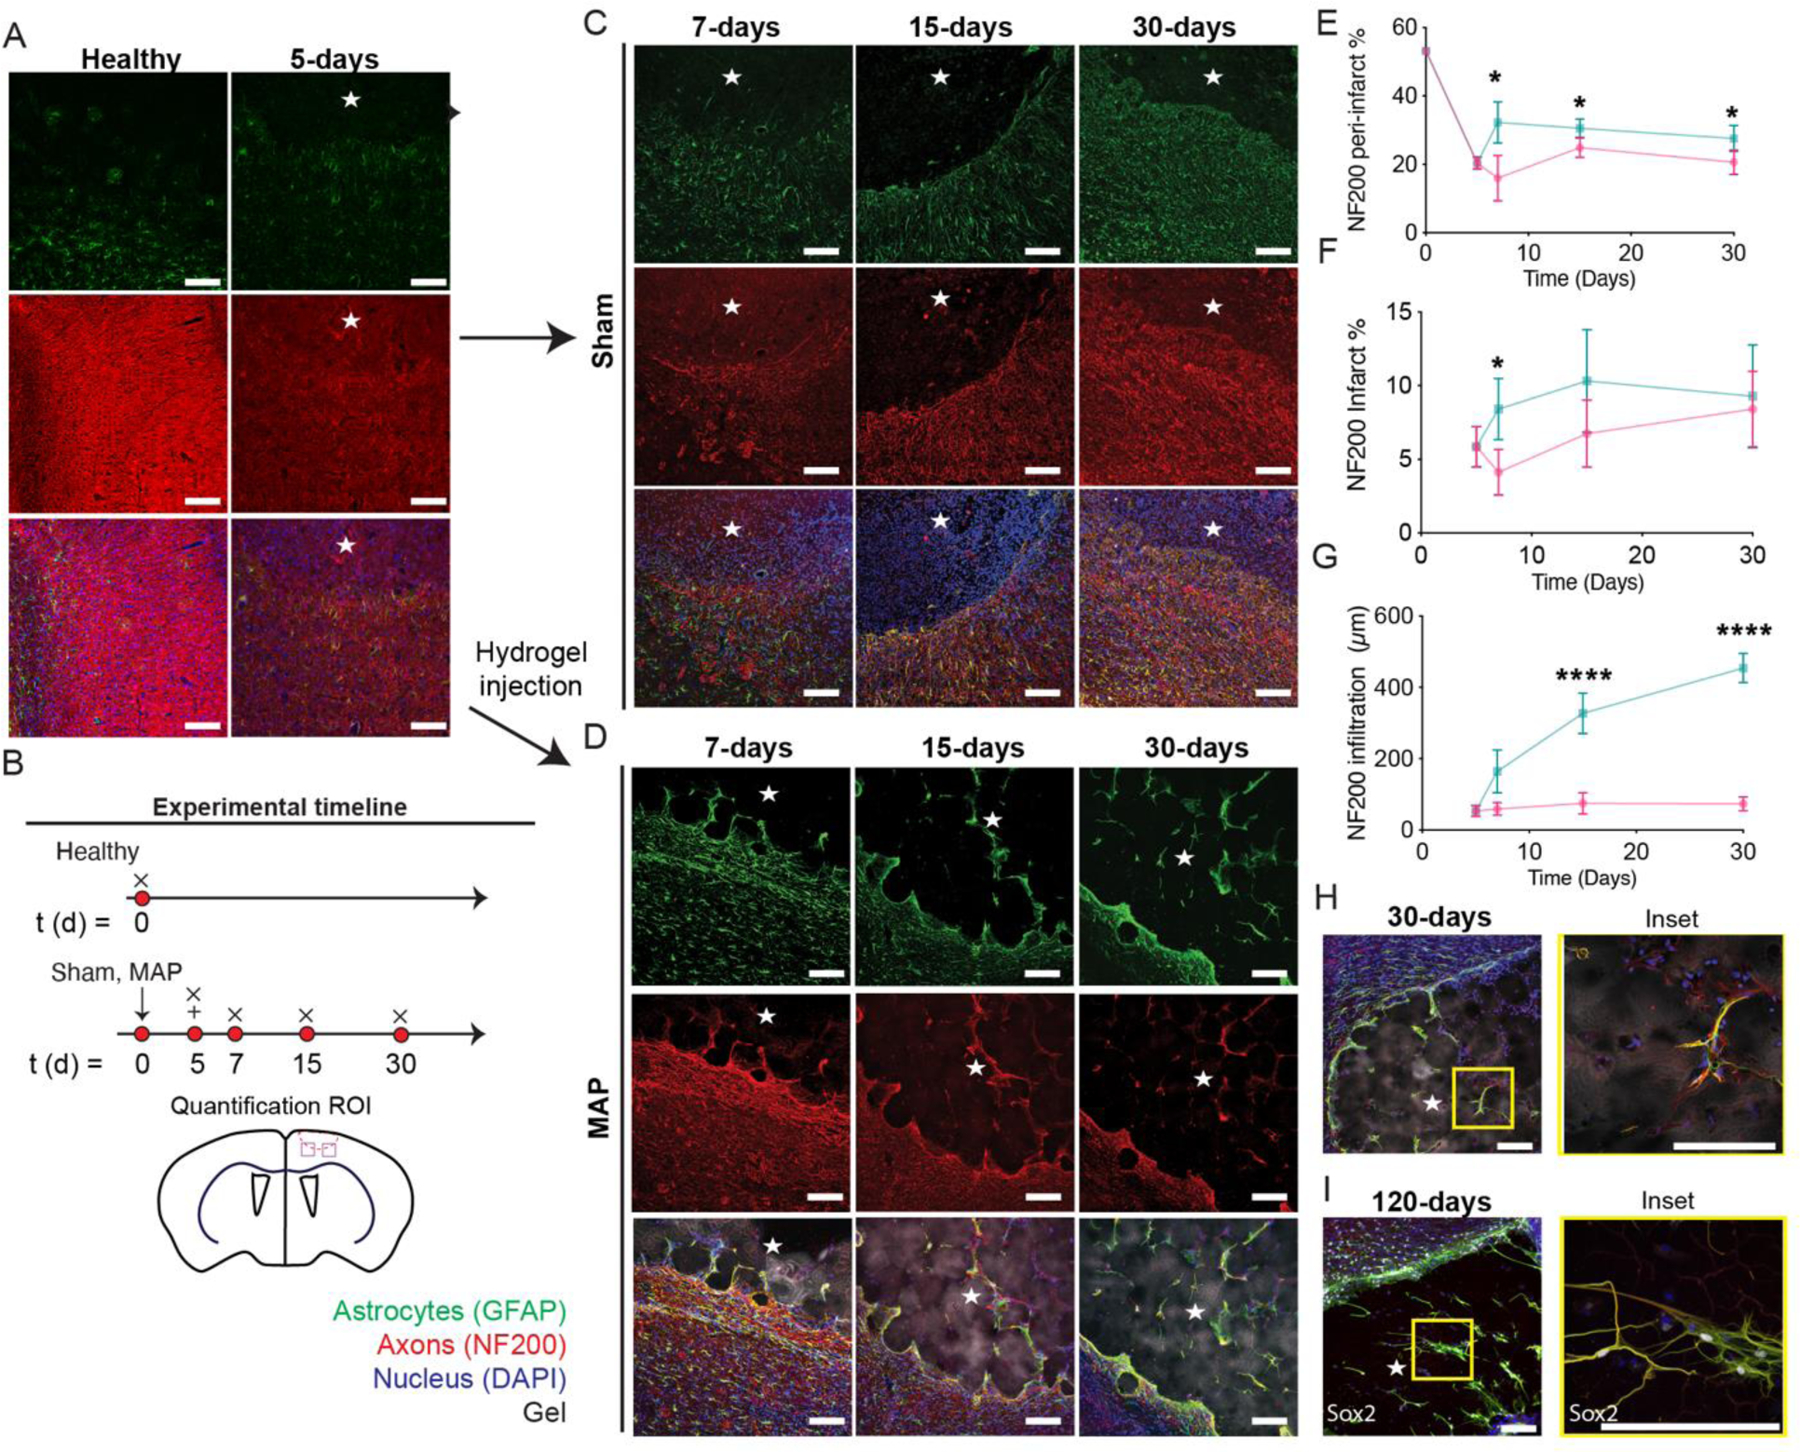
Figure 5.

A. IHC images showing reactive astrocytes and axons of healthy tissue and 5 days post stroke through GFAP and NF200 staining. B. Schematic of experimental timeline where arrow signifies stroke day, + signifies injection day (MAP only), and x signifies sacrifice and analysis time point. Sham is stroke only with no injection. C. IHC images of sham stroke tissue showing reactive astrocytes and axons at 1-, 2-, 4-weeks post stroke through GFAP and NF200 staining. D. IHC images of MAP gel treated stroke tissue showing reactive astrocytes and axons at 1-, 2-, 4-weeks post stroke through GFAP and NF200 staining. E. Quantification of percent area of axons in the peri-infarct through NF200 staining comparing sham and HA MAP treated conditions. F. Quantification of percent area of axons in the infarct through NF200 staining comparing sham and HA MAP treated conditions. G. Quantification of axon infiltration distance into infarct through NF200 staining comparing sham and HA MAP treated conditions. H. IHC images of co-residing astrocytes and axons at 4-weeks post stroke through GFAP and NF200. I. IHC images of co-residing astrocytes and axons at 120 days post stroke through GFAP and NF200. All scale bars = 100µm. All measurements were done on FIJI. Statistical analysis was done in GraphPad Prism using two-way ANOVA analysis of variance followed by a multiple comparisons test (Sidak) comparing between condition at each timepoint. The dots in each plot indicate the number of animals (n = 5 biological replicates) that were analyzed per-group and were considered independent experiments. *, **, ***, **** means p < 0.05, 0.01, 0.001, 0.0001. ☆ represents the stroke cavity.
