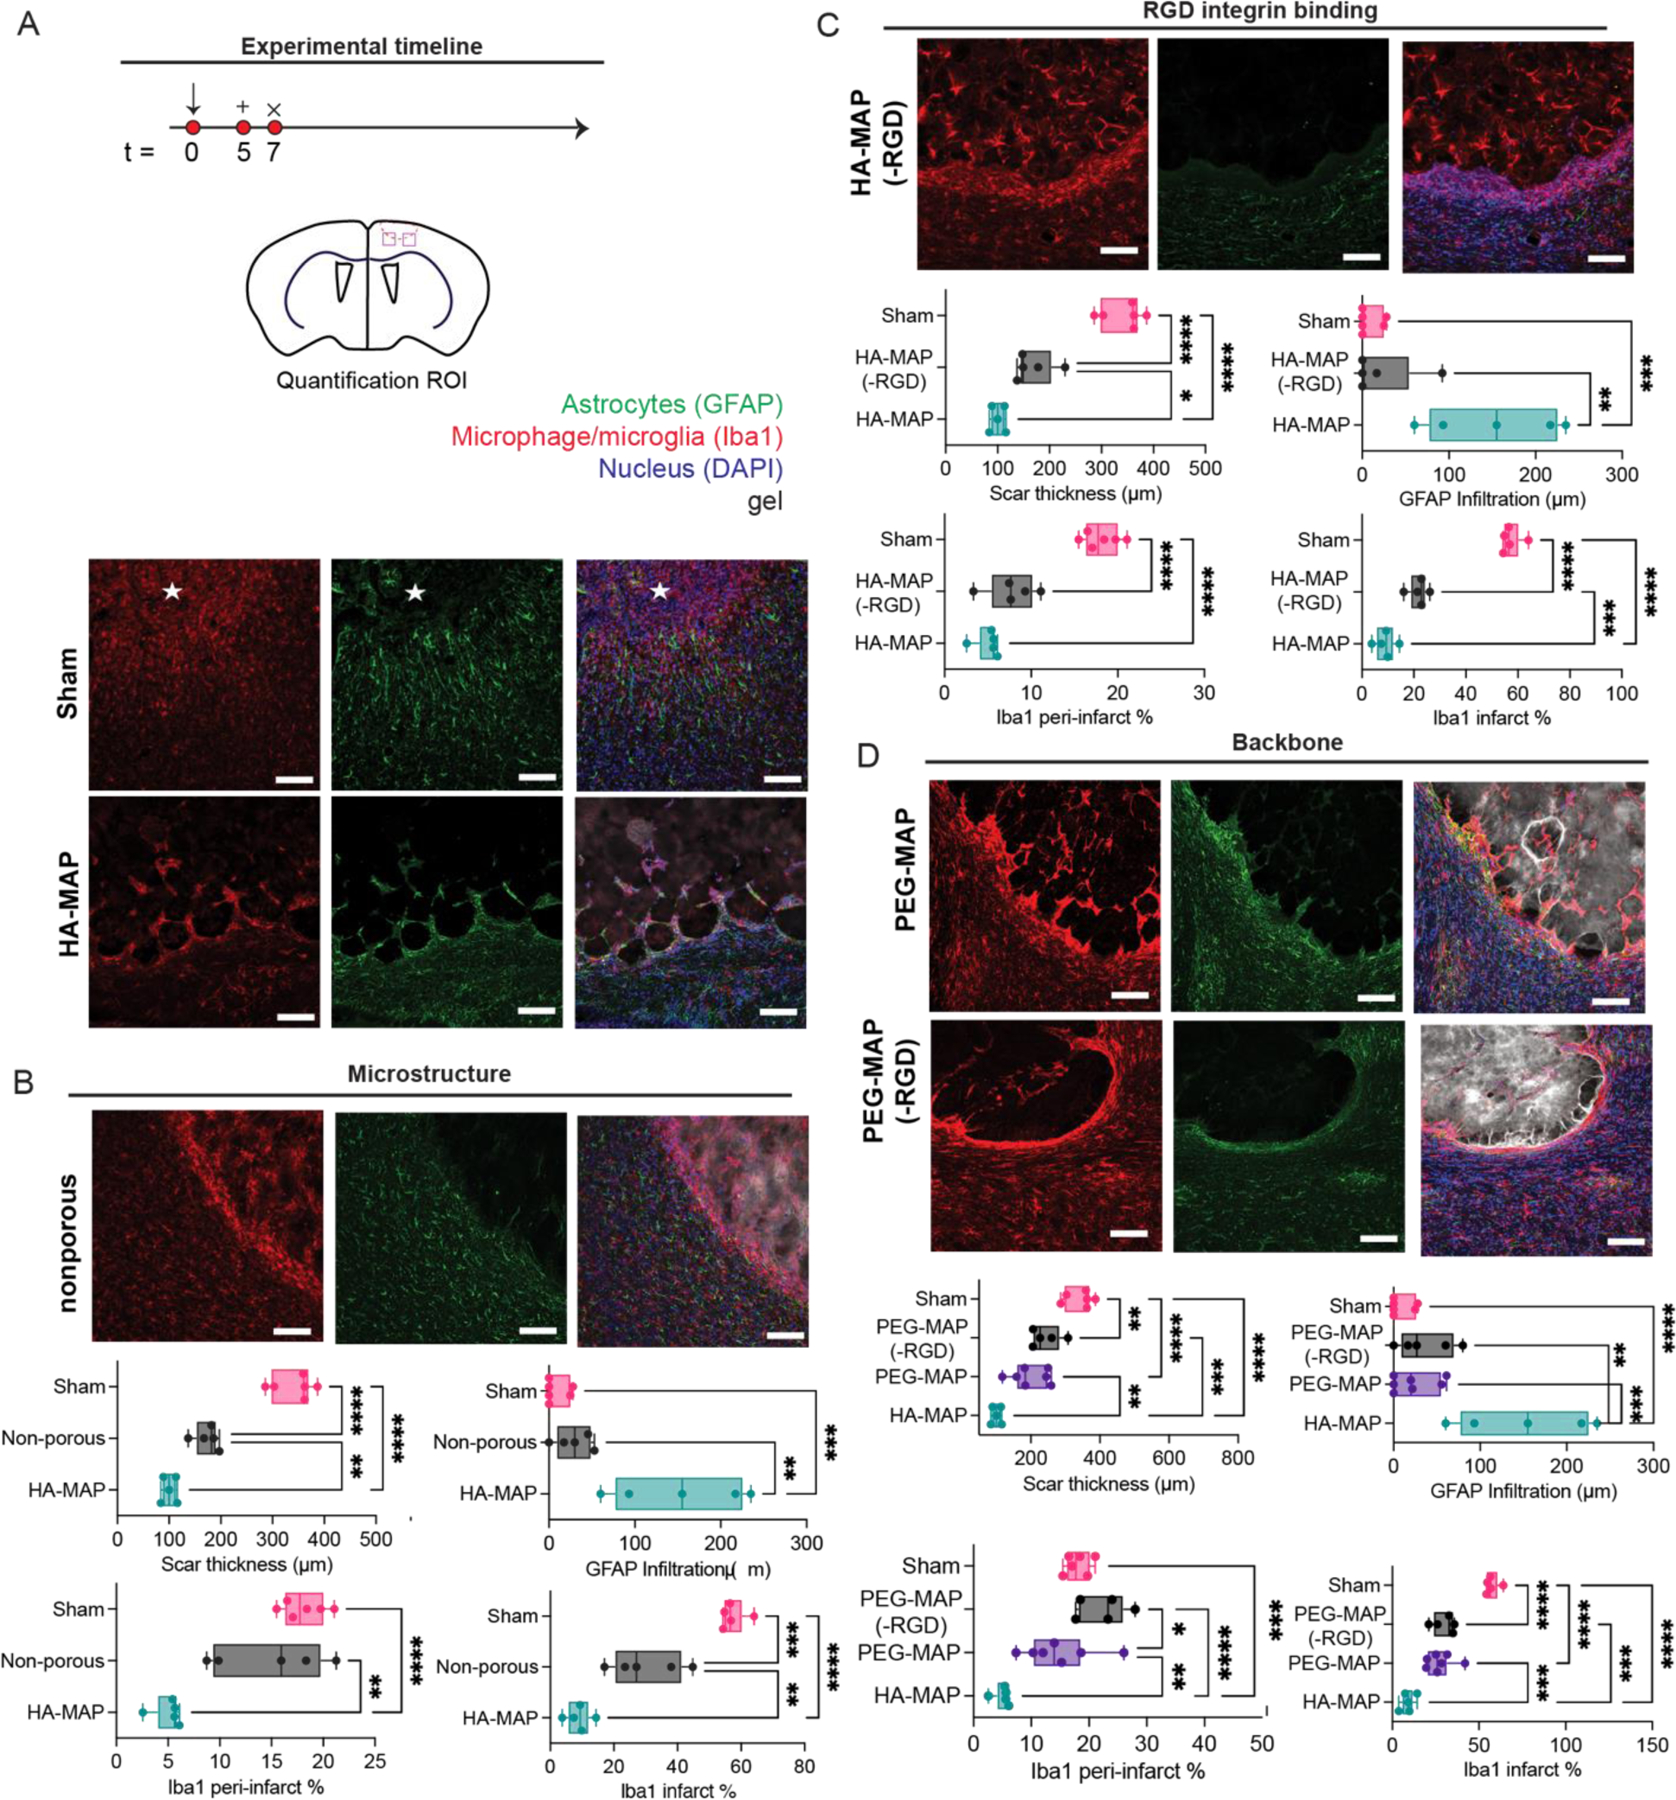
Figure 6.

A. Schematic of experimental timeline where arrow indicates day of stroke, + indicates day of injections, and x indicates day of sacrifice and analysis. IHC images for sham and HA MAP treated brains at 1 week post stroke staining for GFAP and Iba1. B. IHC images of non-porous treated brains staining for GFAP and Iba1. Quantification of reactive astrocytes and reactive microglia testing for scar thickness, astrocyte infiltration distance, Iba1 peri-infarct percent area, and Iba1 infarct percent area to analyze the role of hydrogel microstructure through GFAP and Iba1 staining. C. IHC images of HA MAP (-RGD) treated brains staining for GFAP and Iba1. Quantification of reactive astrocytes and reactive microglia testing for scar thickness, astrocyte infiltration distance, Iba1 peri-infarct percent area, and Iba1 infarct percent area to analyze the role of RGD integrin binding through GFAP and Iba1 staining. D. IHC images of PEG-MAP and PEG-MAP (-RGD) treated brains staining for GFAP and Iba1. Quantification of reactive astrocytes and reactive microglia testing for scar thickness, astrocyte infiltration distance, Iba1 peri-infarct percent area, and Iba1 infarct percent area to analyze the role of hydrogel backbone through GFAP and Iba1 staining. All scale bars = 100µm. All measurements were done on FIJI. Statistical analysis was done in GraphPad Prism using one-way ANOVA analysis of variance followed by a multiple comparisons test comparing each condition (Tukey). The dots in each plot indicate the number of animals (n = 5 biological replicates) that were analyzed per-group and were considered independent experiments. *, **, ***, **** means p < 0.05, 0.01, 0.001, 0.0001. ☆ represents the stroke cavity.
