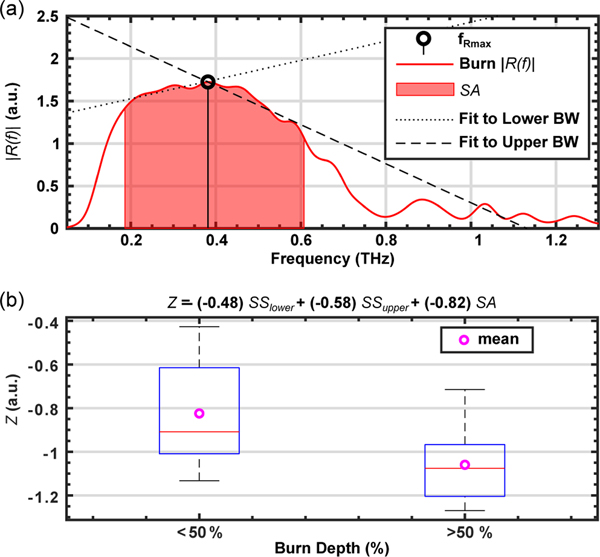
Figure 2.
a) A representative THz amplitude reflectivity, R(f), is plotted as an example to demonstrate the calculation of spectral slopes, SS, and spectral area, SA. The red area shows SA within the flower and fupper frequencies. The dotted line shows the linear fit between flower and fRmax to calculate SSlower. The dashed line shows the linear fit between fRmax and fupper to calculate SSupper. b) The ability of the Z parameter to differentiate between burn wounds is statistically tested (1-way ANOVA, p = 0.0016) against histological assessment of the burn depth. The THz measurements and biopsies were both obtained on Day 4 postburn. The burns were grouped into two categories: those with depth of damage greater or less than 50% of the dermis layer.

