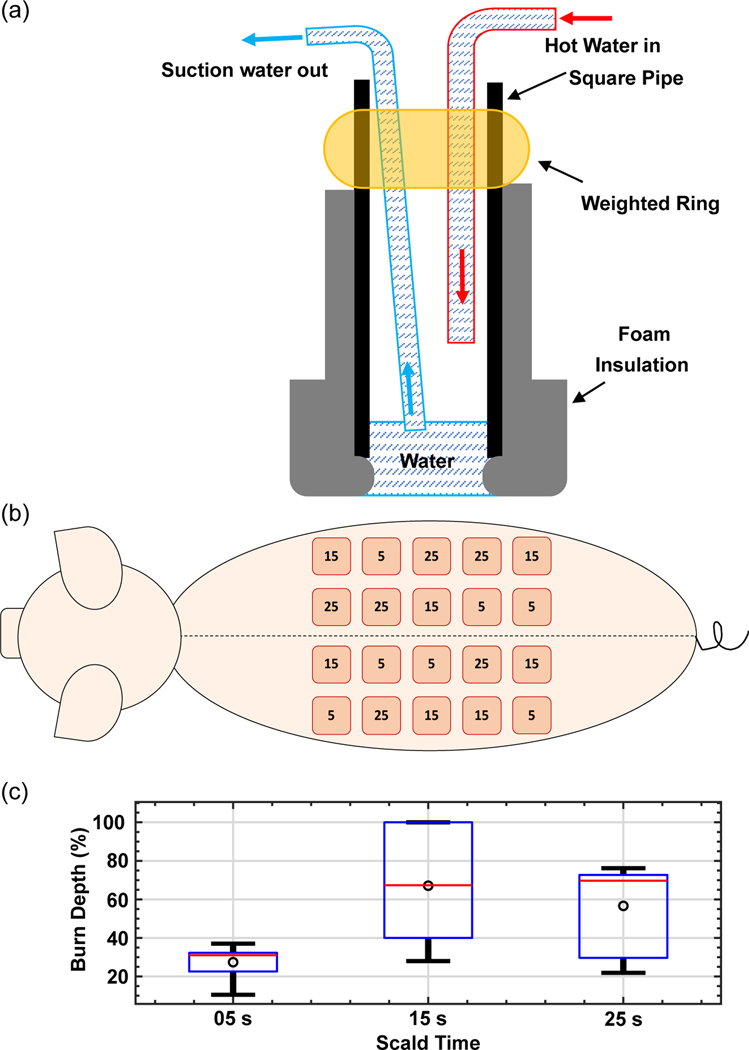
Figure 4.
a) The schematic of the scald burn induction device is shown, where 95 °C water would come in direct contact with the skin. b) Scald condition locations are illustrated where the numbers in each circle represent the heat exposure duration in seconds. c) Dermal burn depth percentage (normalized by total dermal thickness) are plotted for each experimental condition, as determined by a histopathologist using Day 4 H&E-stained sections.

