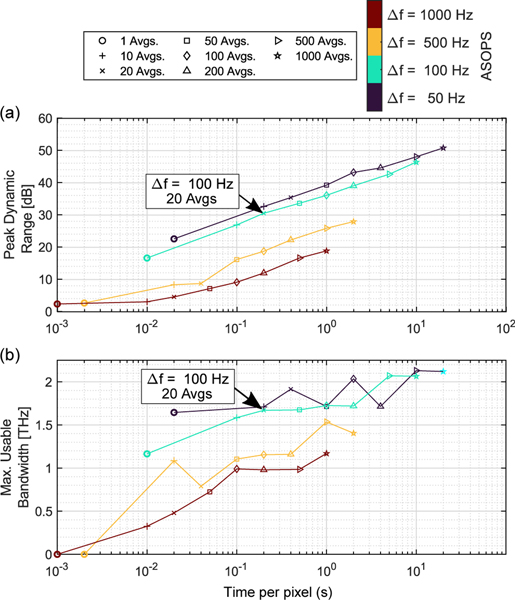
Figure 7.
a) Peak dynamic range shows a linear relationship with acquisition time per pixel. Values for peak dynamic range were calculated as the ratio of the maximum frequency domain amplitude to the noise floor level. b) The calculated bandwidth shows a monotonically increasing relationship with the data acquisition time or increasing the number of averages. Marker shapes correspond to the number of averages and marker colors represent the ASOPS difference frequency. Large black arrows represent the optimal operation parameters selected for this study (Δf = 100 Hz, 20 Avgs).

