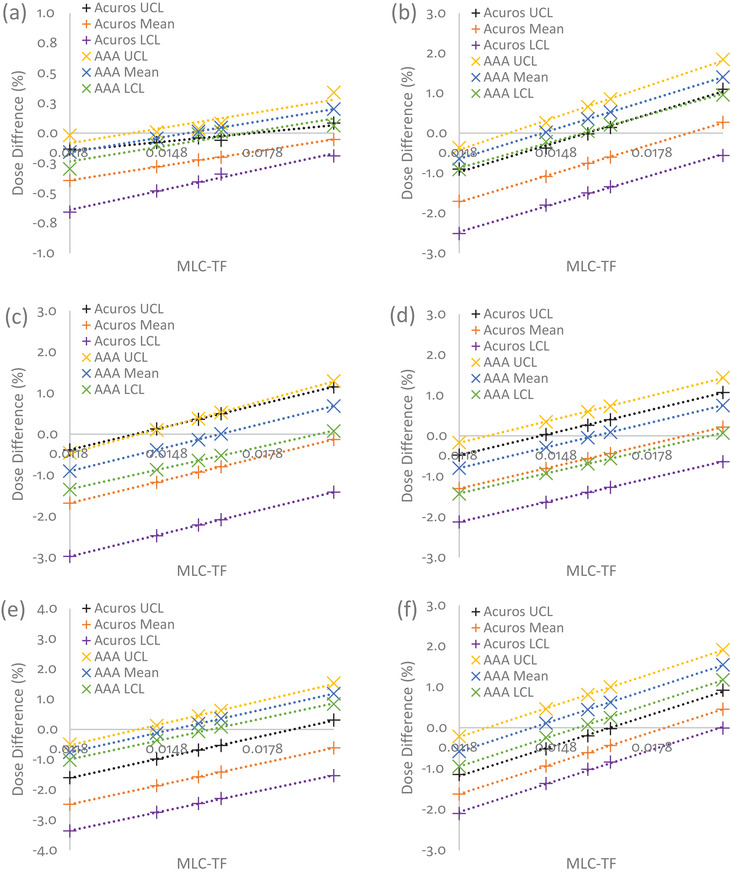
FIGURE 5.

Percent dose differences with changes in MLC‐TF for head and neck plans calculated for different dose calculation algorithms: (a) brain, (b) larynx, (c) PTV1, (d) PTV2, (e) mandible, and (f) left parotid. The black, orange, and purple + symbols represent changes in Acuros’ UCL, mean, and LCL, respectively. Yellow, blue, and green x symbols represent changes in AAA's UCL, mean, and LCL, respectively. The dotted lines represent the linear fit. AAA had a narrower range between control limits than Acuros. For most contours, Acuros matched the RPA plan approximately at an MLC‐TF of 0.02, while AAA matched the RPA plan approximately at am MLC‐TF of 0.015. MLC‐TF, multileaf collimator transmission factor; PTV, planning target volume; UCL, upper control limit; LCL, lower control limit; AAA, Analytical Anisotropic Algorithm; RPA, Radiation Planning Assistant
