
Figure 3. C24, ceramide ratios, and classical circulating factors as biomarkers of cancer cachexia.
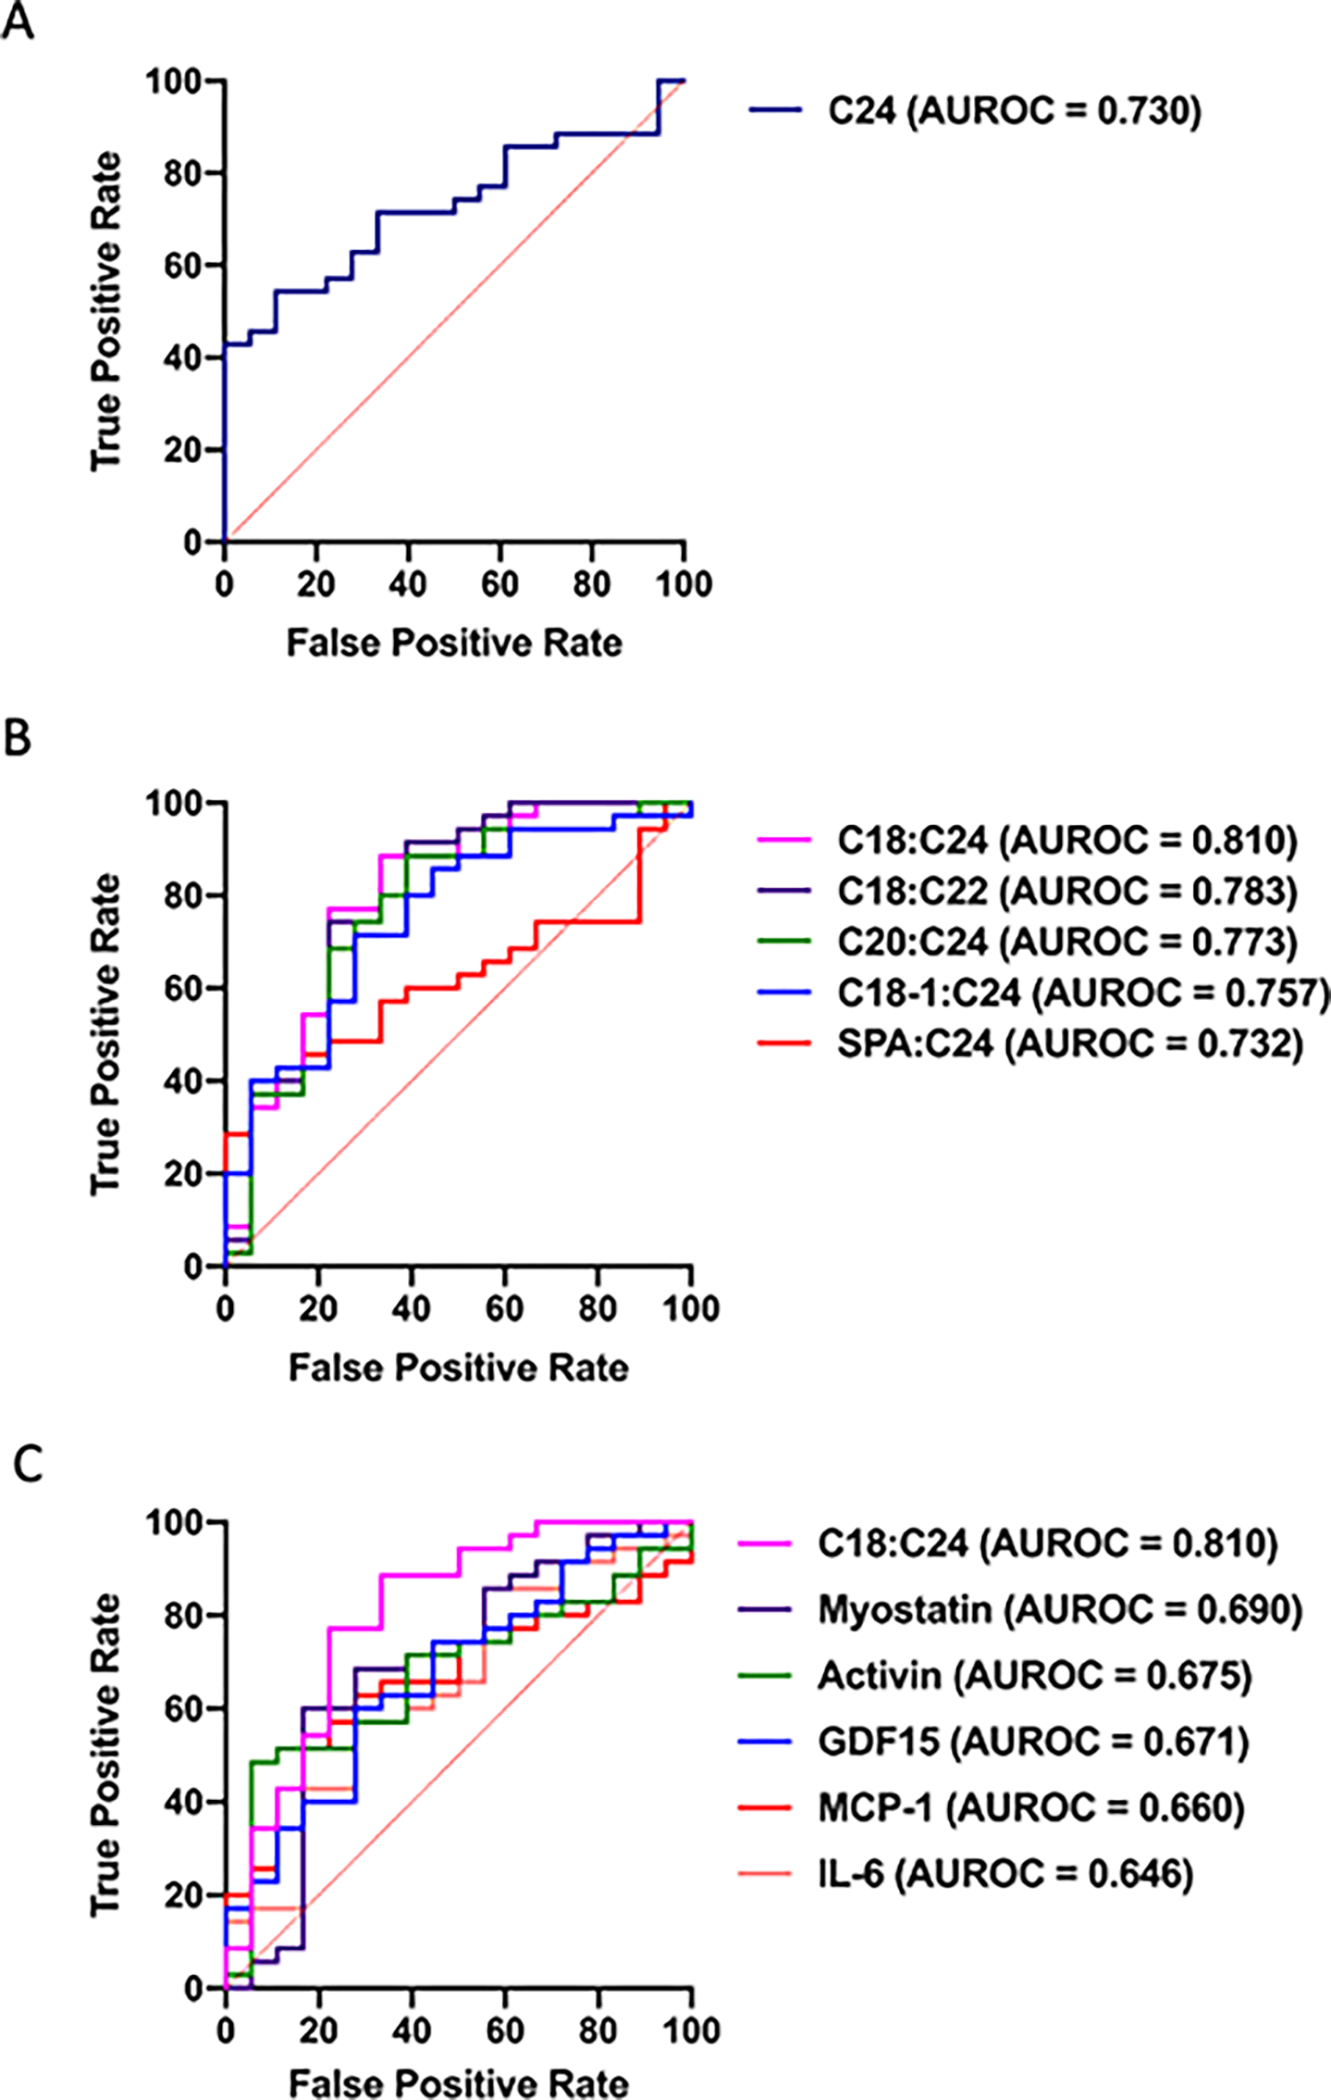
(A) ROC curve for distinguishing non-cachectic from cachectic PDAC patients by C24. (B) ROC curves for distinguishing non-cachectic from cachectic PDAC patients by ratios of sphingolipids (C) ROC curve for C18:C24 distinguishing non-cachectic from cachectic PDAC patients compared to ROC curves for other previously proposed biomarkers of cancer cachexia. ROC curves are displayed as sensitivity vs. (1-specificity) value. n=18 treatment-naïve, non-cachectic PDAC patients, n=35 treatment naïve, cachectic PDAC patients.