
Fig 2. Calibration and simulation results of the CRS model.
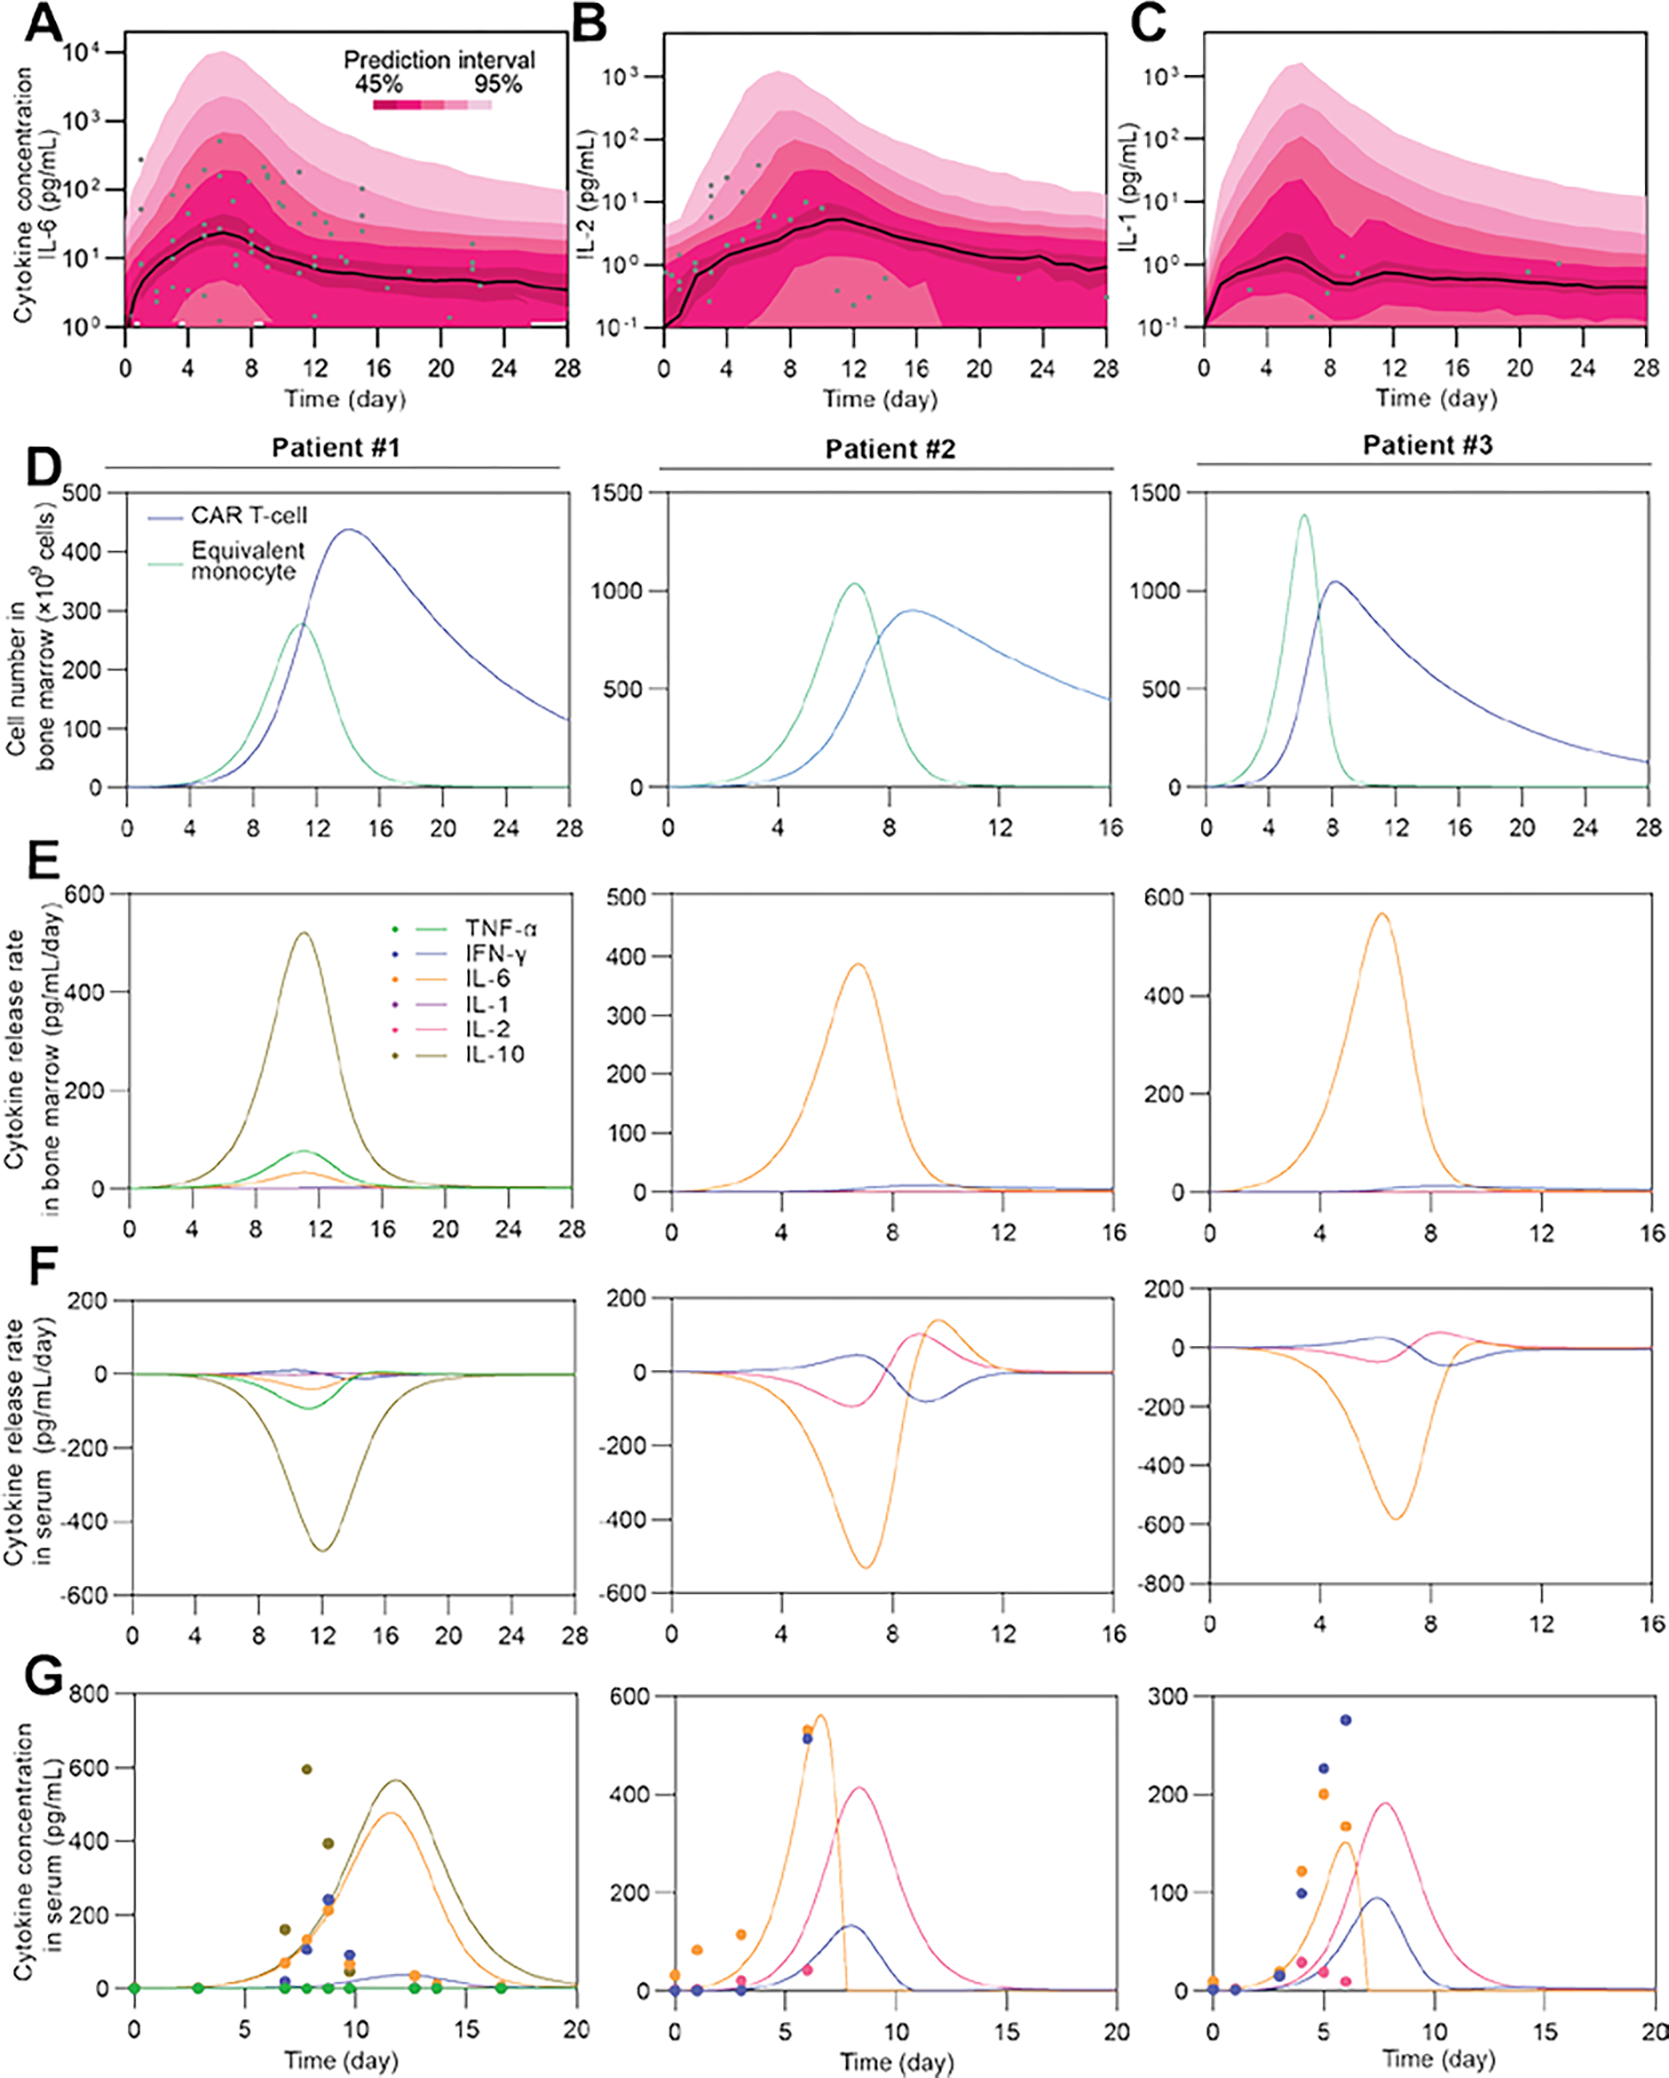
(A–C) Calibration results and simulation using Monte Carlo method to estimate the distribution of IL-6 time series of the population. Black lines show median, color bands show prediction intervals with different probabilities, and dots show clinical observations. Patient number = 17. (D–F) Simulated time series of CAR T-cell and equivalent monocyte number in bone marrow (D), and cytokine release rates in bone marrow (E) and serum (F). Negative release rate in F means clearance of cytokines. (G) Experimental (dot) and simulated (line) time series results of concentrations of different cytokines in serum.