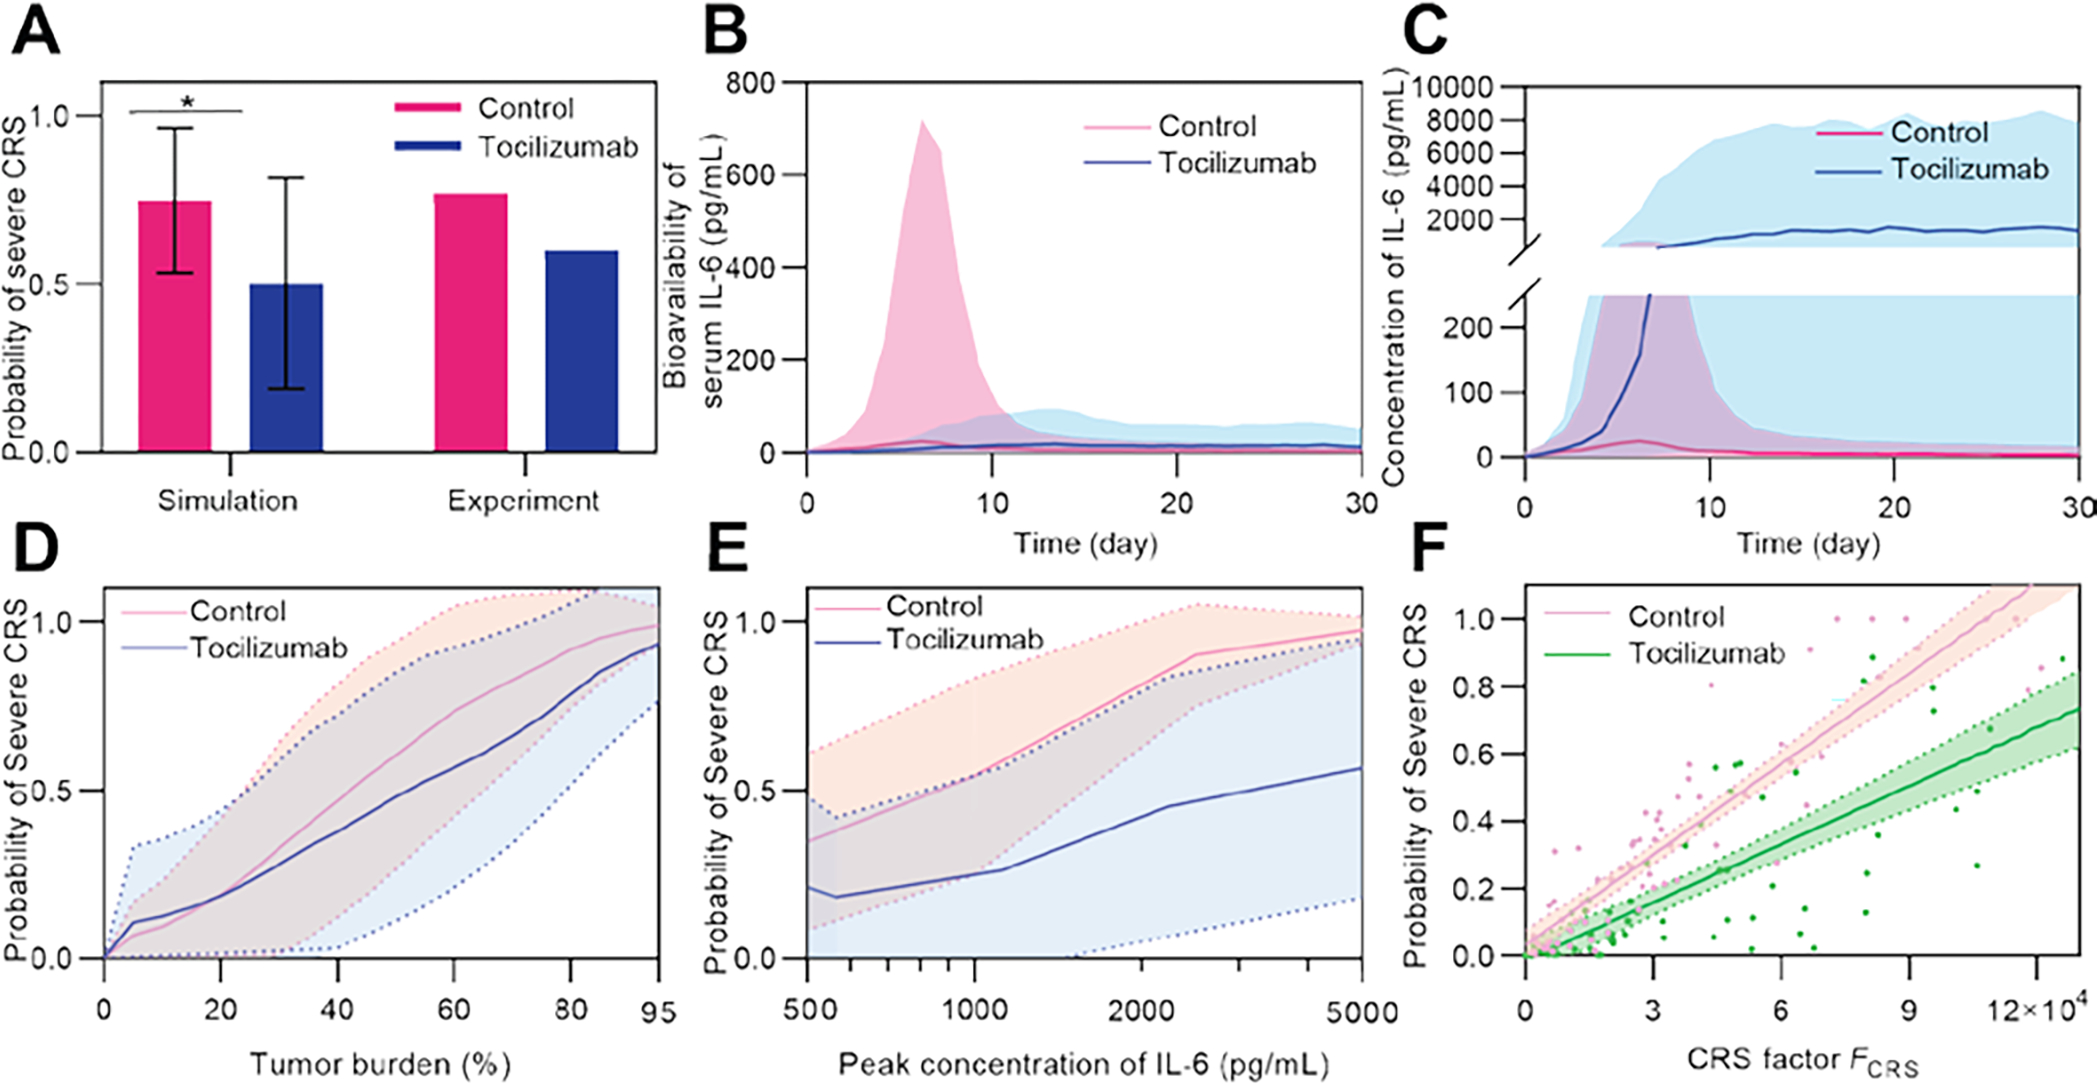
Fig 6. Mitigation of CRS with tocilizumab.

(A) Simulated probability of CRS in the control and tocilizumab treatment groups. Simulation was conducted among a virtual cohort (size = 1500) with high tumor burden of 40–95% to match the high tumor burden cohorts (≥ 40%) in clinical trials [12] (patient number = 15 (tocilizumab) and 26 (control)). Error bars denote mean ± SD. P-values were calculated using Student’s t-test. *p<0.05. (B) Comparison of simulated bioavailability and (C) concentration of IL-6 between the control and tocilizumab treatment groups. Lines denote median and bands denote quartile boundaries. Cohort size = 200. (D, E) Variation of probability of severe CRS as tumor burden (D) and peak concentration of IL-6 (E) changed, and comparison between the control and tocilizumab treatment groups. Solid lines show median and dotted lines show quartile boundaries. Cohort size = 400. (F) Monte Carlo simulation of two virtual patient cohorts show decreased probability of severe CRS with tocilizumab treatment compared to the control group. Dots show virtual patients, lines show linear fit, and bands denote 95% confidence interval. Cohort size = 100.
