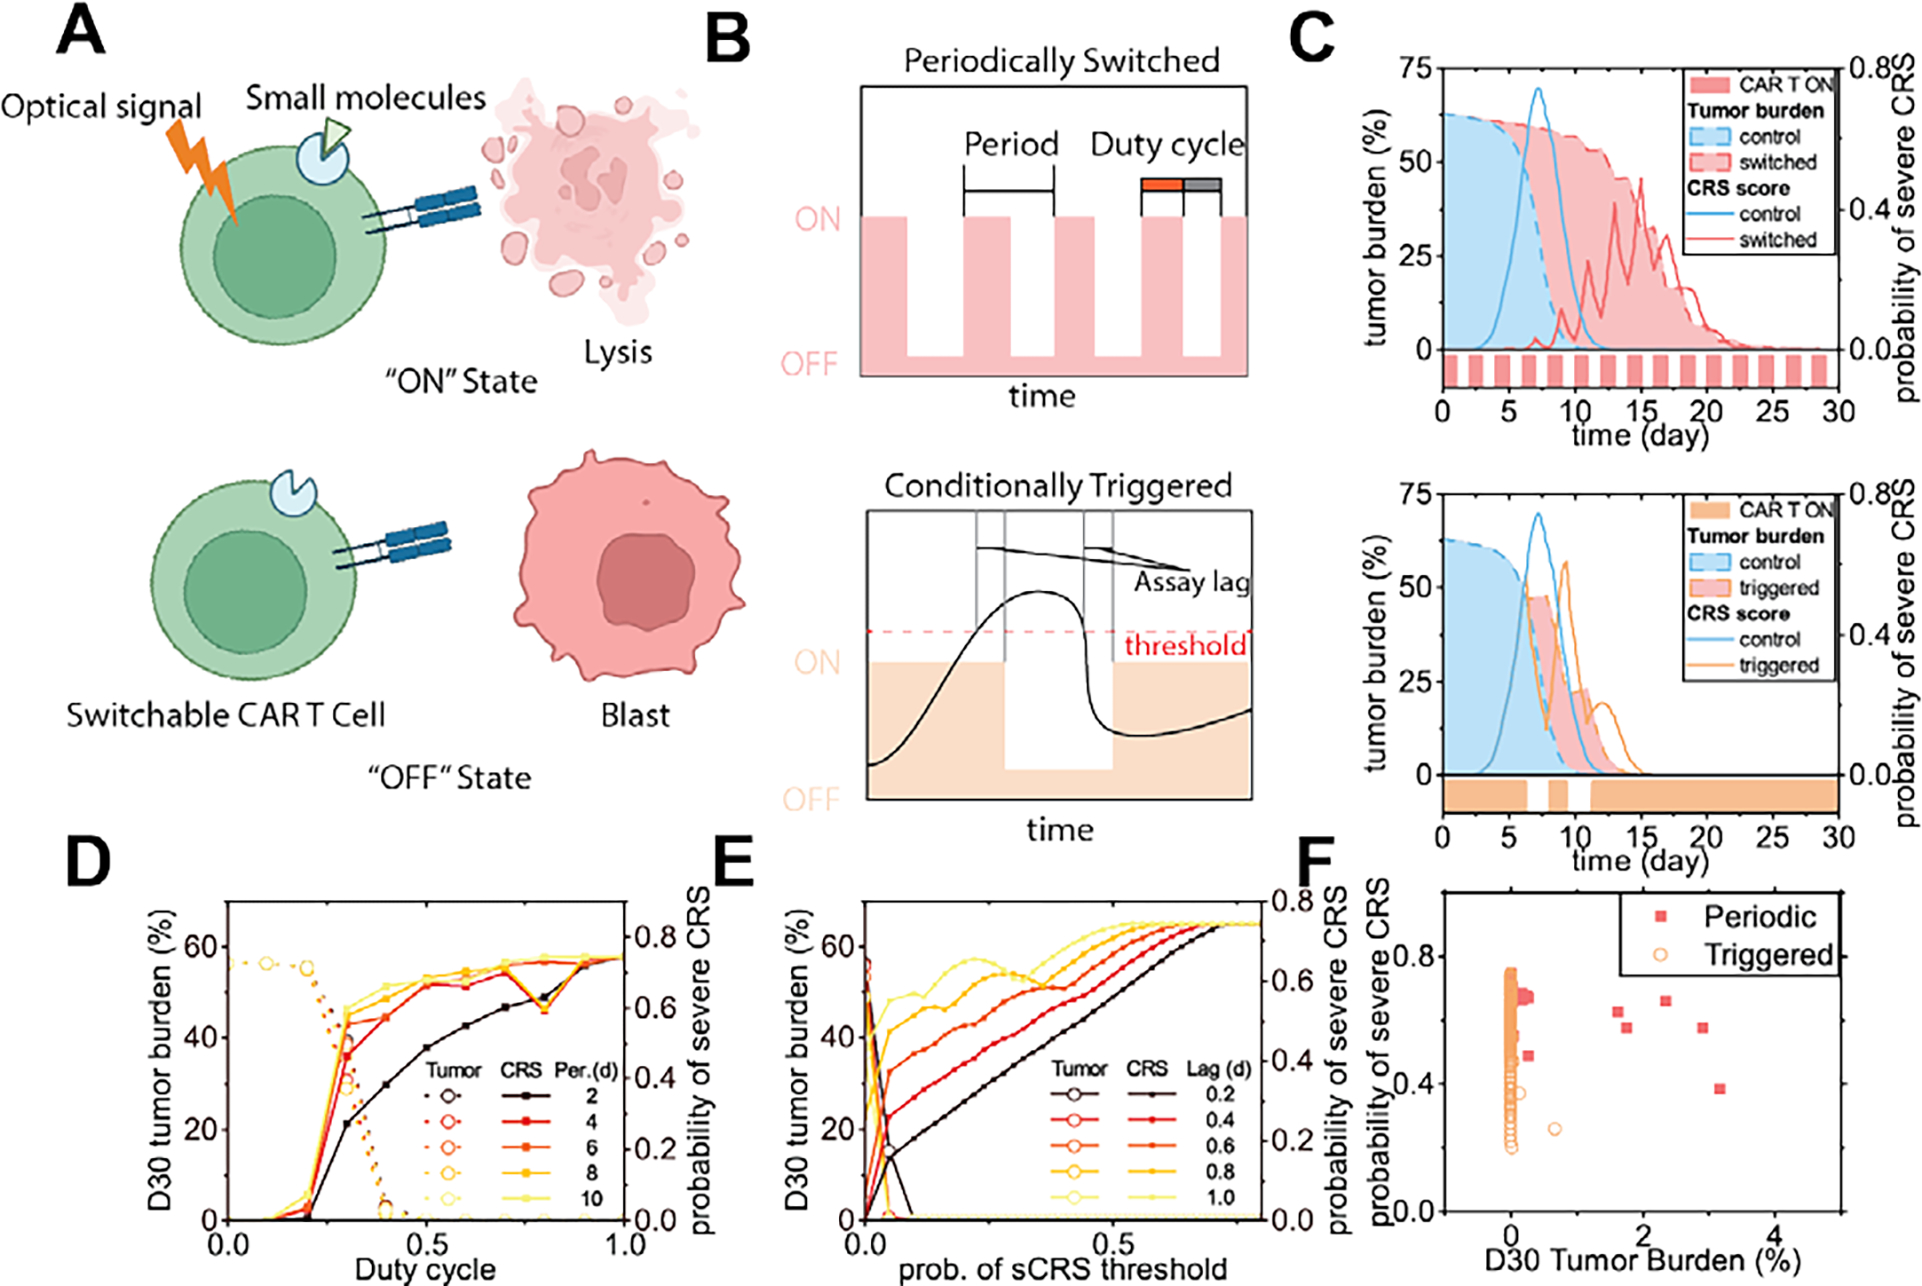
Fig 8. In-silico modeling of the treatment schemes and outcomes of switchable CAR T-cell products.

(A) Scheme of switchable CAR T-cells. (B) Two possible switching schemes. (C) Tumor burden and probability of severe CRS responding to switching of the CAR T-cells through two different schemes (patient #2). (D) Tumor burden at day 30 and peak CRS probability of the periodic switching scheme, as the duty cycle and the period changed. (E) Tumor burden at day 30 and peak CRS probability of the conditionally triggered scheme, as the severe CRS probability threshold and the assay lag changed. (F) Peak probability of severe CRS and D30 tumor burden, as the factors of the two controlling schemes were varied.
