
Figure 8. The conformational free energy landscape of α-synuclein monomers and dimers.
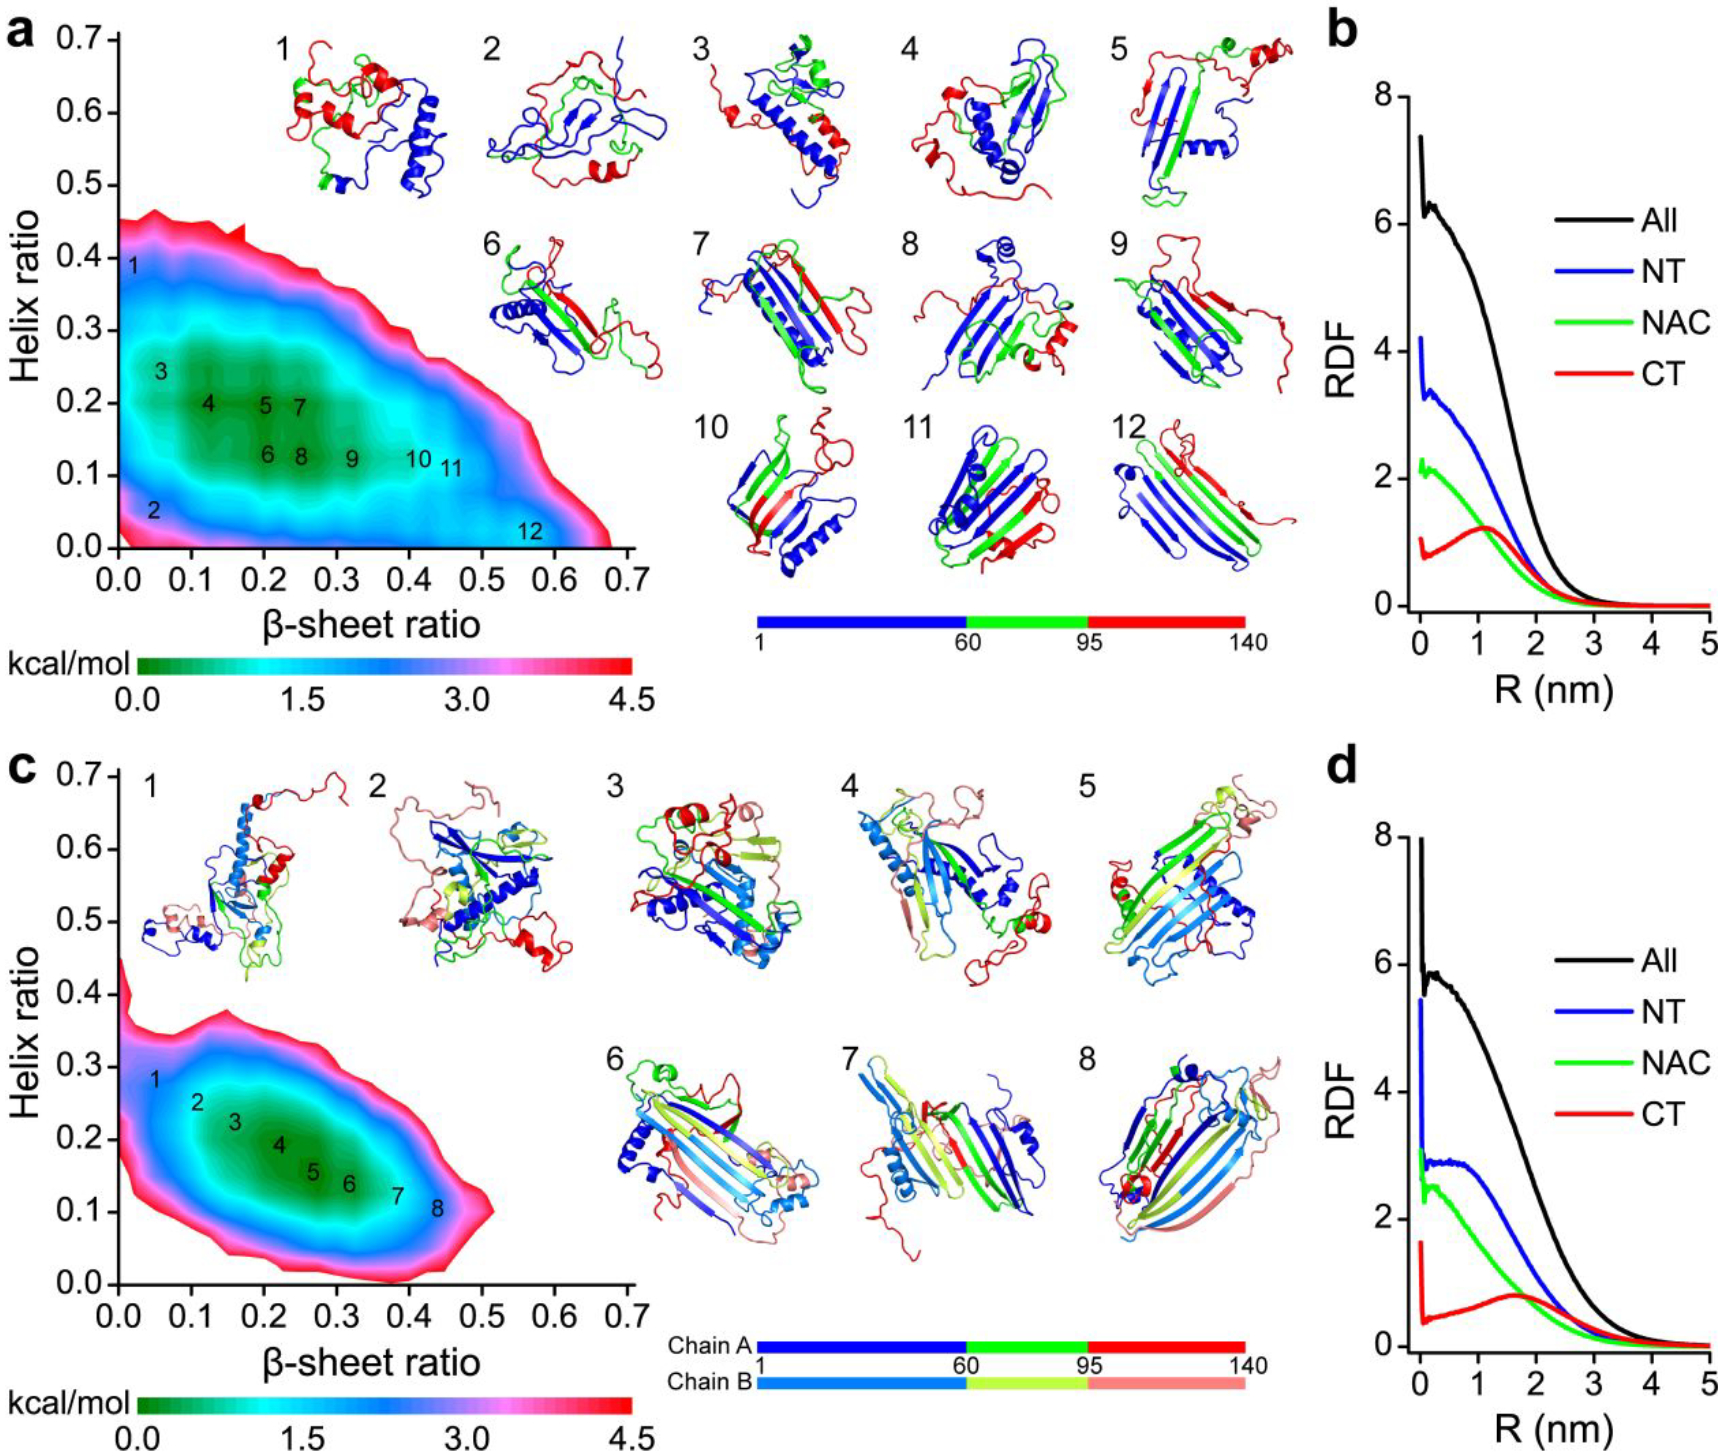
The potential mean force as a function of β-sheet and helix contents of α-synuclein monomers a) and dimers c). Representative structures labelled in the PMFs are also shown. The radius distribution function of Cα atom from N-terminus, NAC region, and C-terminus in α-synuclein monomers b) and dimers d).