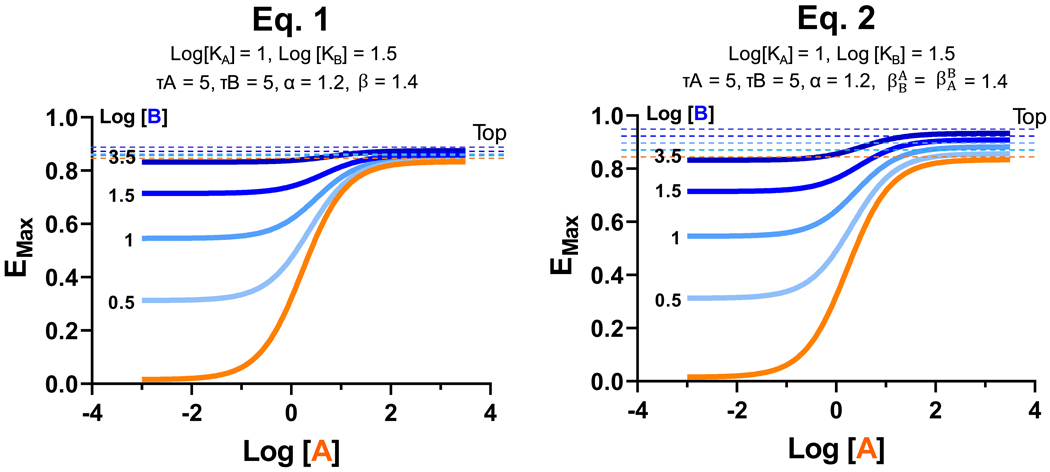
Box 1, Figure I. Optimizing the extended operational model.
While both Eq. 1 (left) and Eq. 2 (right) capture the qualitative effects of positive allosteric modulation, they produce distinct effects on agonist-modulator dose-response curve Top shifts. The most appropriate model may depend on the characteristics of the allosteric modulator, receptor system and assay platform. The horizontal lines represent the Top values of the corresponding colored response curves.

