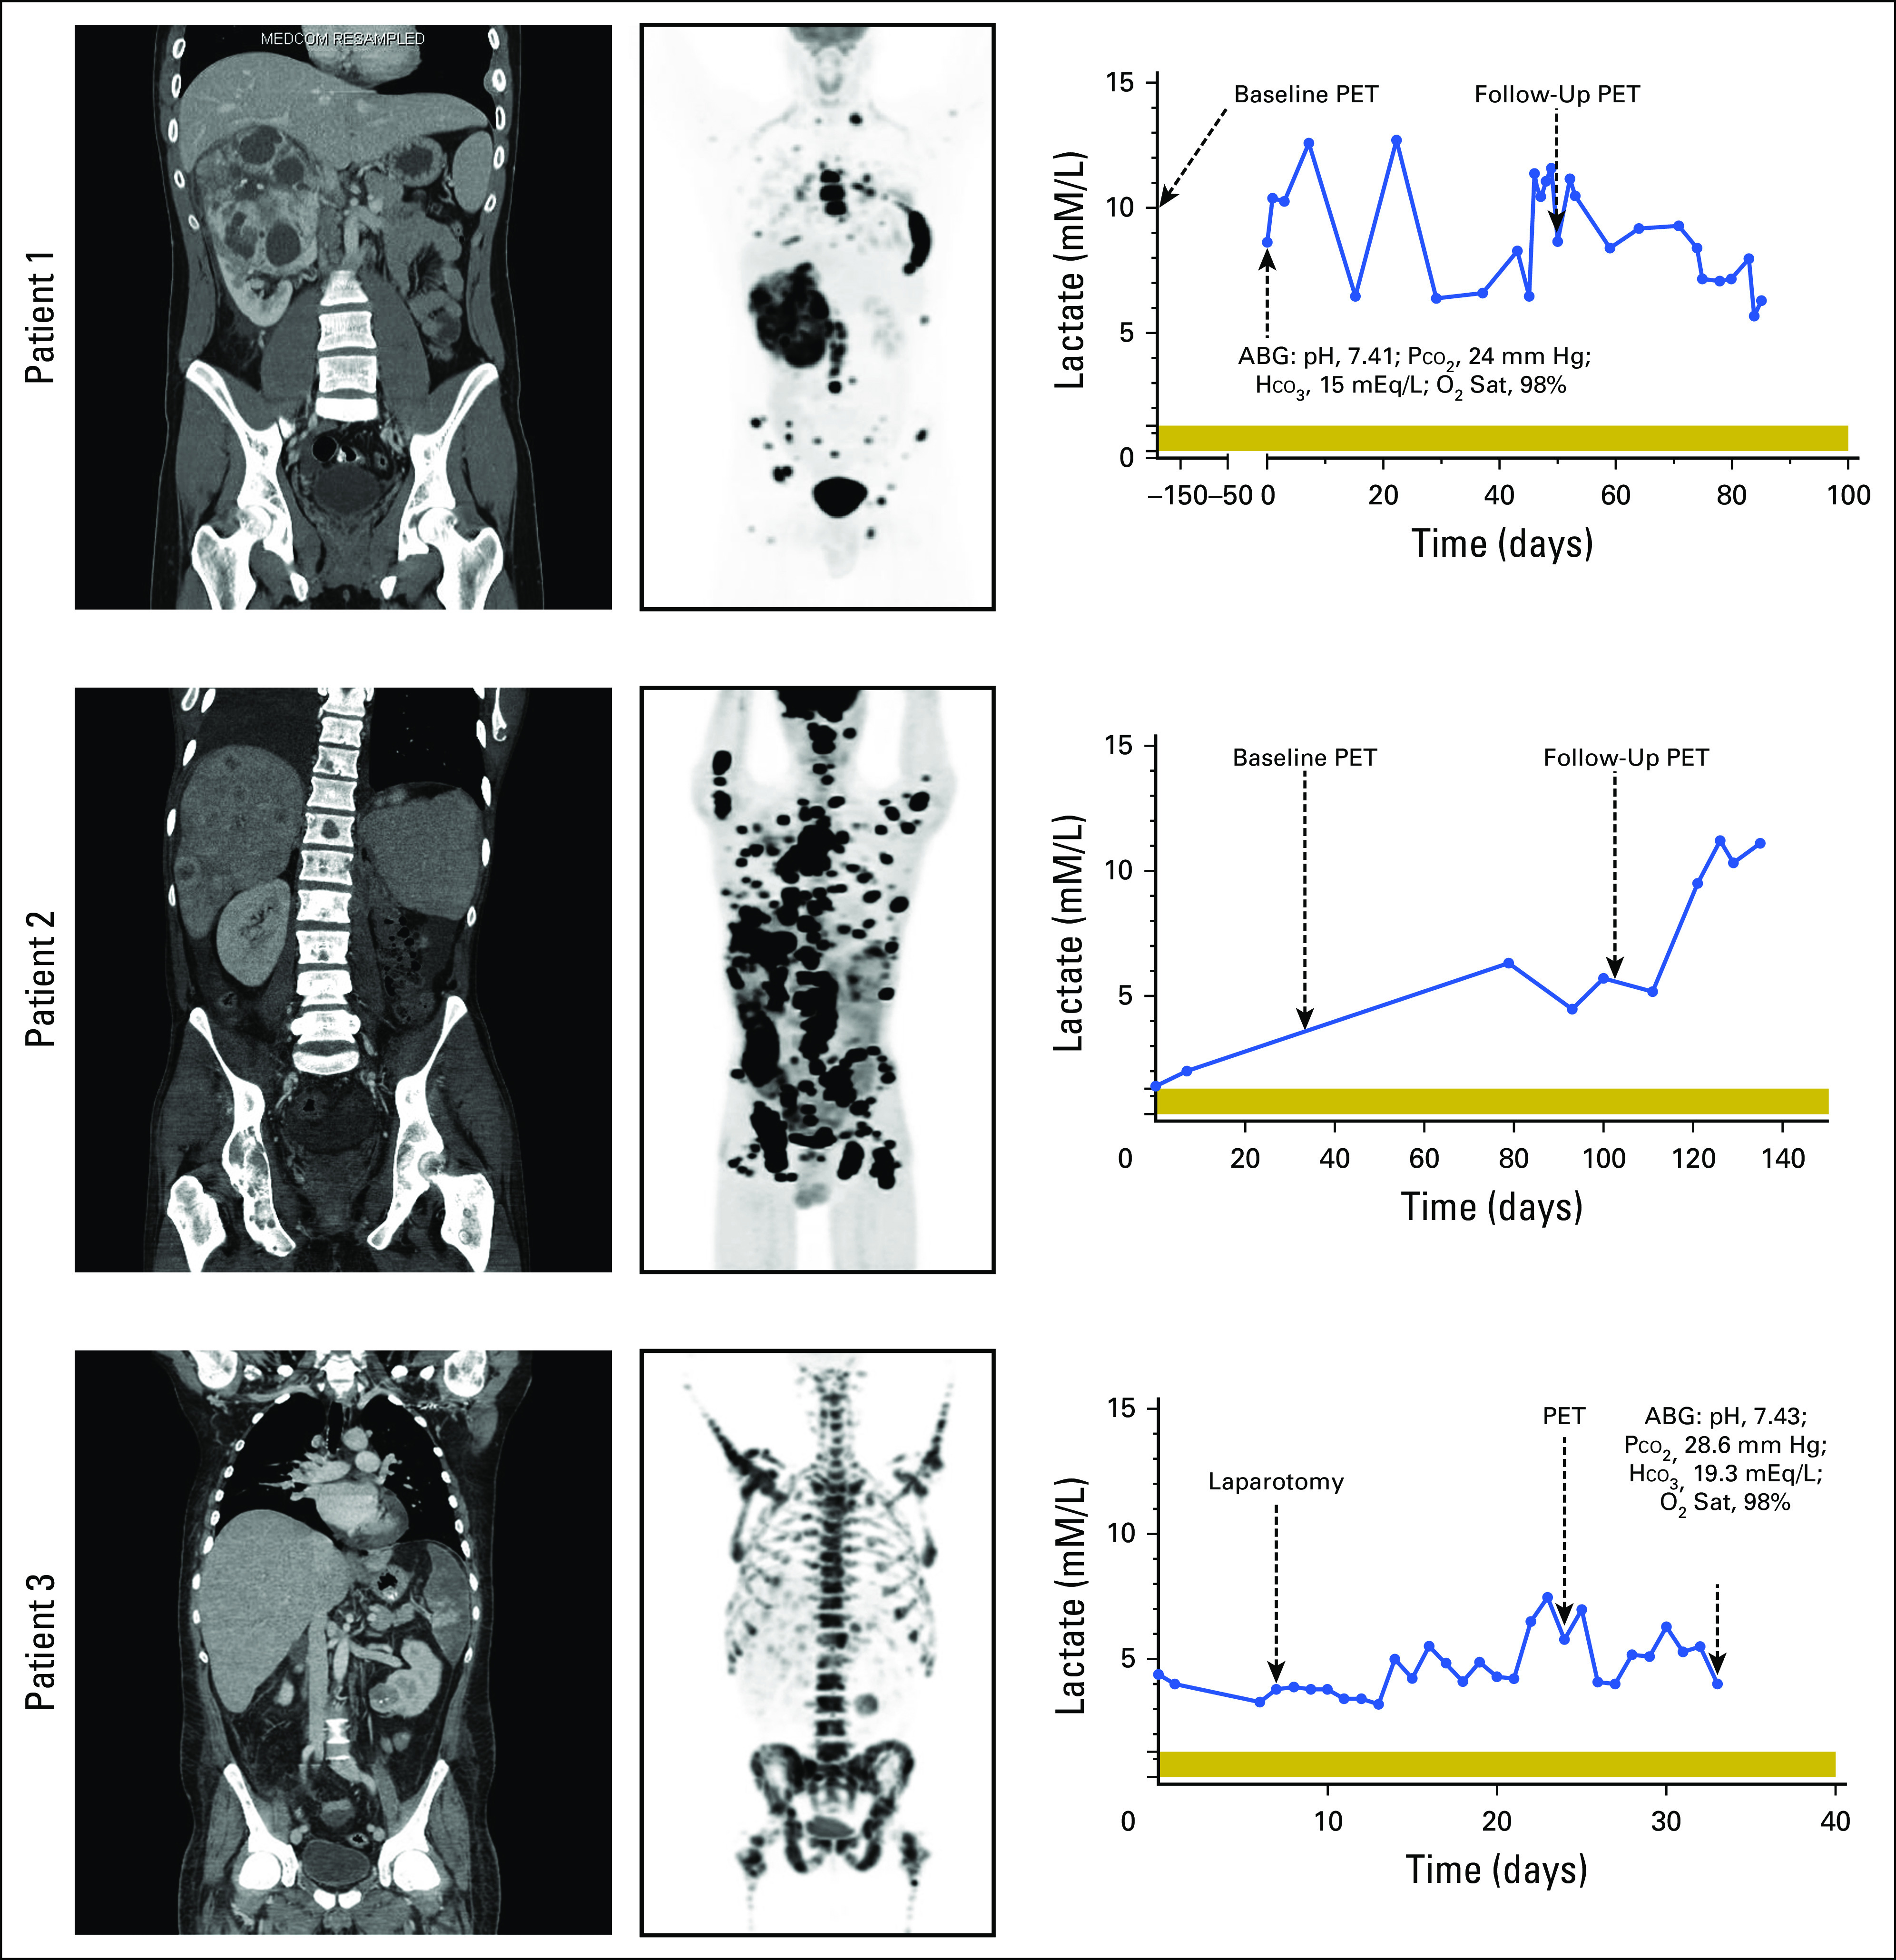
Fig 1.

Computed tomography (CT), [18F]fluorodeoxyglucose (FDG) positron emission tomography (PET), and blood lactate levels. Left panels are baseline body CT scans and center panels are baseline [18F]FDG-PET scans of patients 1, 2, and 3. Right panels are corresponding blood lactate levels over the monitoring period for patients 1, 2, and 3. Normal range of lactate level is 0.3 to 1.3 mM/L, as indicated by the horizontal shading. ABG, arterial blood gas; HCO3, bicarbonate; O2 Sat, oxygen saturation; Pco2, partial pressure of carbon dioxide.
