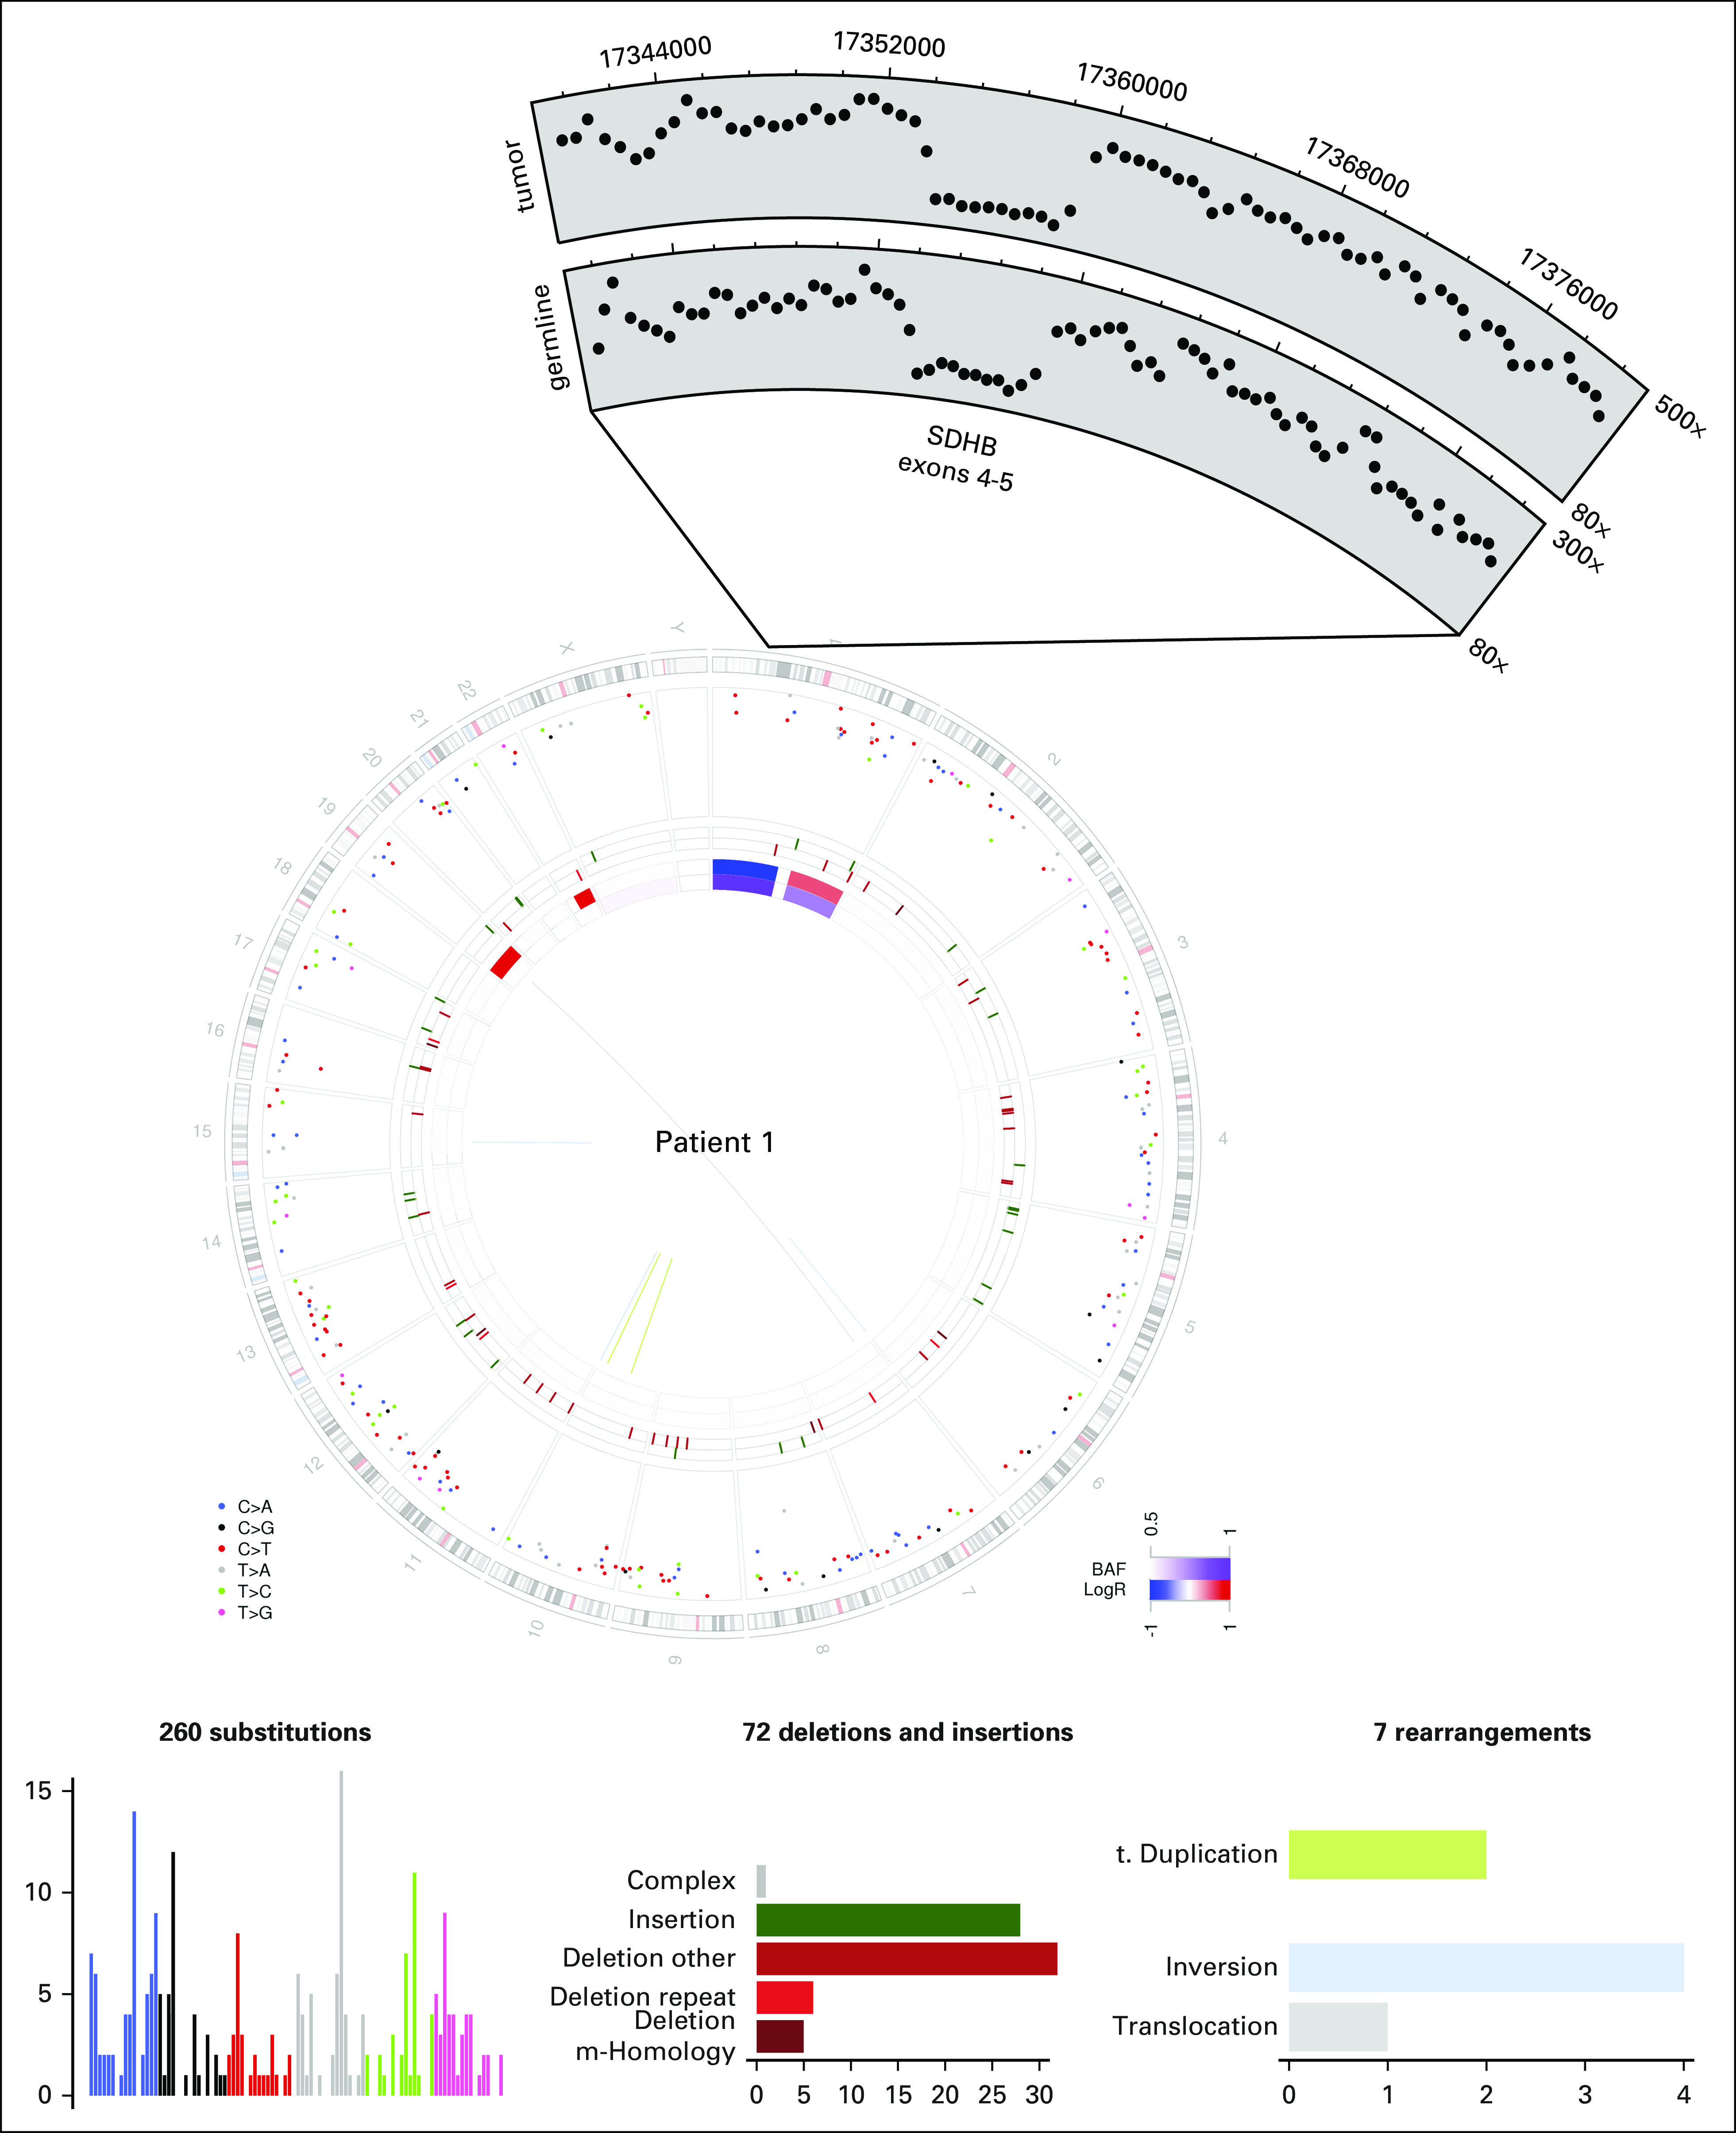
Fig 3.

Whole-genome sequencing (WGS) of patient 1’s primary kidney tumor. Circos plot of patient 1’s WGS. The two innermost tracks depict the copy number changes (red, increase; blue, decrease; purple, allelic imbalance, one allele amplified or deleted) in the tumor when compared with the normal for patient 1. The outermost track shows the intermutation distance for substitutions each plotted according to the type of nucleotide change. The middle track shows the genomic positions of the small insertion (green) and deletion (red) along the genome. Rearrangements are plotted as arcs inside the Circos plot. Also shown is a zoomed-in view of the coverage over the SDHB locus in both tumor and matched normal samples, demonstrating the same deletion of exons 4 and 5 in both samples.
