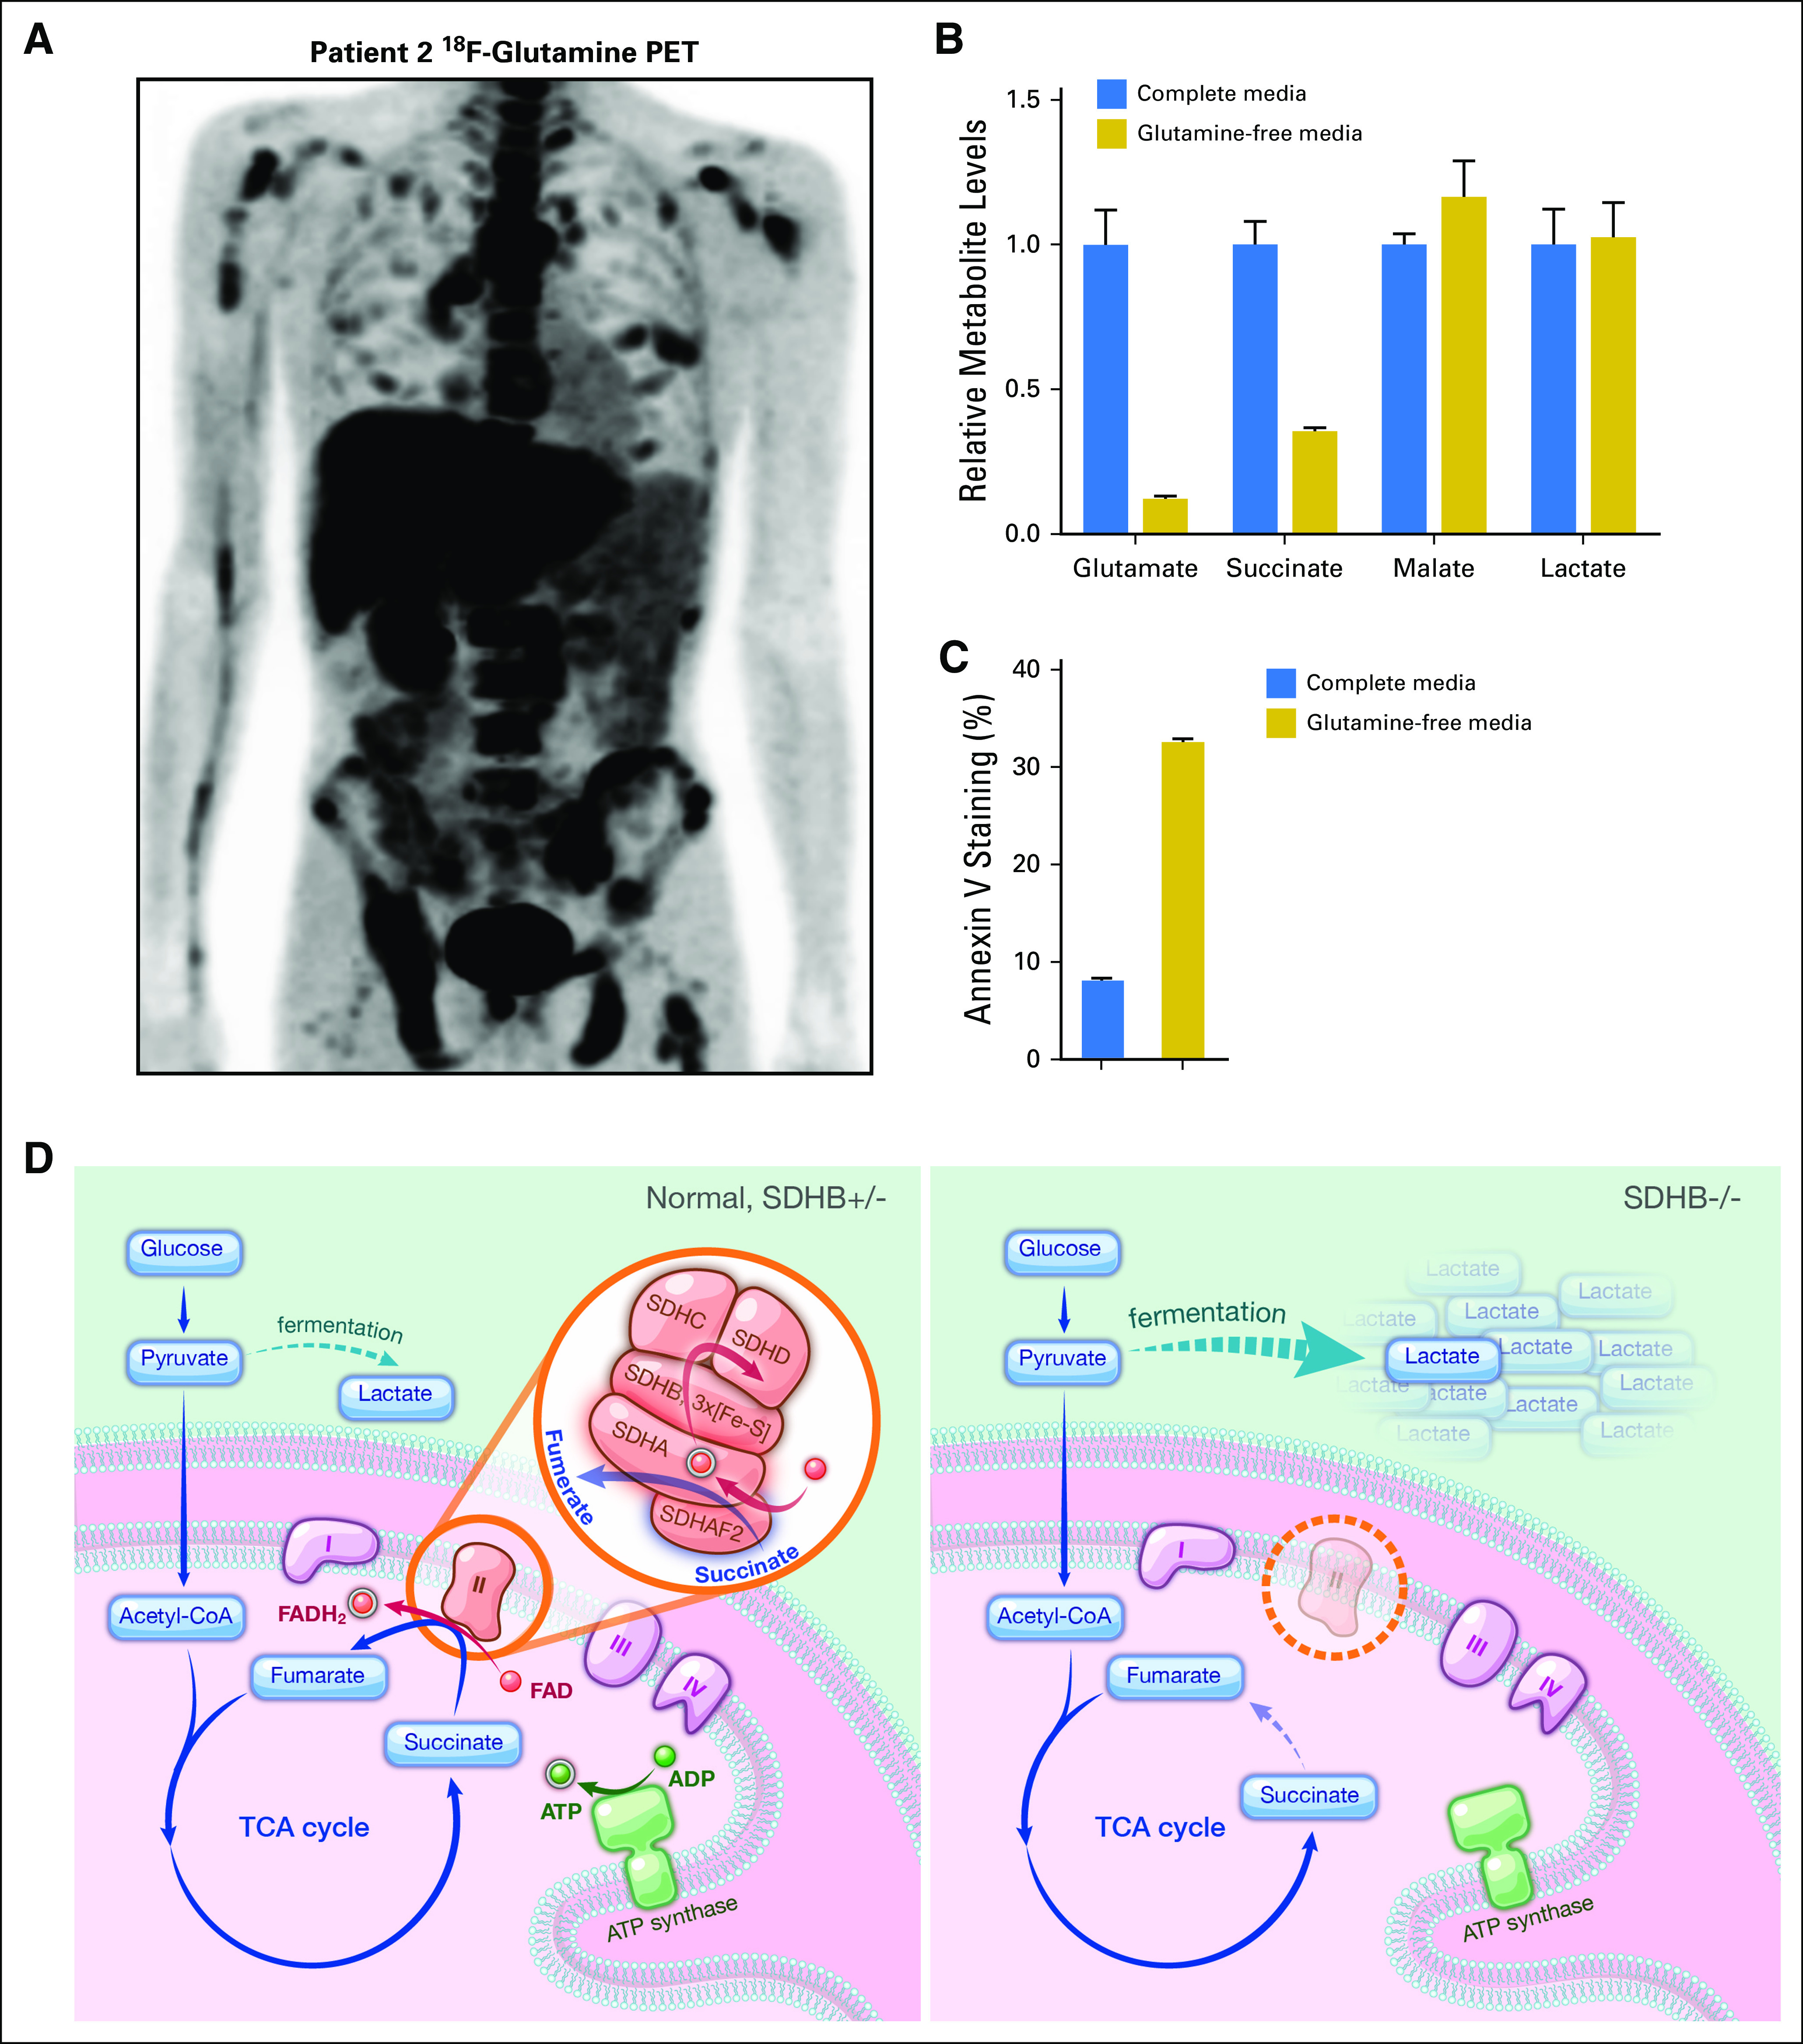
Fig 6.

Glutamine metabolism and model of lactate production in SDHB-deficient human kidney cancer. (A) The 18F-glutamine positron emission tomography (PET) scan of patient 2. (B) Levels of intracellular metabolites. Relative metabolite levels were measured in SDHB−/− primary cell cultures after 6 hours of glutamine starvation. Counts are normalized to cell numbers, and results from full complete media are denoted at 1. Error bars indicate standard deviation (n = 3). (C) Measurement of apoptosis. Annexin V staining of apoptotic cells was determined in SDHB−/− primary cell culture after 72 hours of glutamine deprivation. Error bars indicate standard deviation (n = 3). (D) Model depicts the increased glucose flux and lactate production in SDHB-deficient cancer cells. CoA, coenzyme A; FAD, flavin adenine dinucleotide; TCA, tricarboxylic acid.
