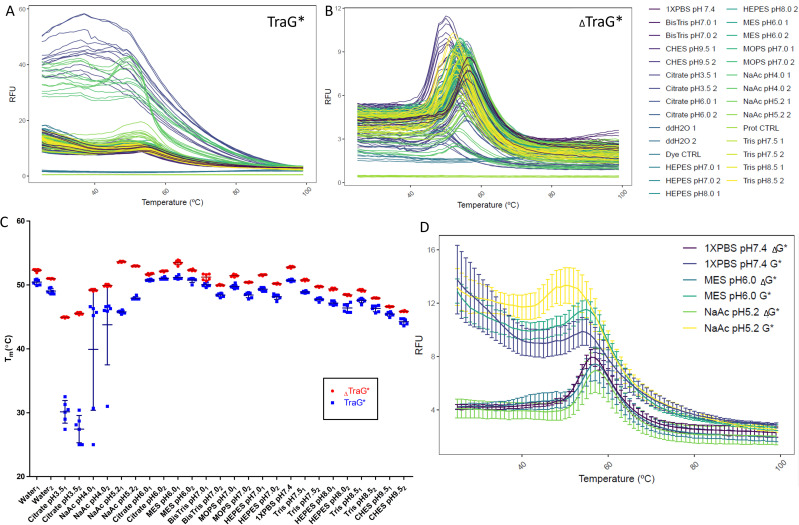
FIG. 3.
Melting curve plots displaying the temperature dependent unfolding of (a) HisTraG*R100 and (b) ΔTraG*R100 in various buffer conditions [seen in the legend right of (b)] as detected using SYPRO orange. Each buffer was at a concentration of 50 mM [except Nanopure water (ddH2O) and PBS], where one represents the addition of 50 mM NaCl in the buffer and two includes 200 mM NaCl. Six (6) replicates of each experiment are shown. (c) Mean melting temperatures with ±SD of the TraG* variants in all tested buffer conditions. (d) Average melting curve plots of the top three stabilizing buffer conditions for both ΔTraG*R100 and TraG*R100, as determined by the Tm of these average curves.

