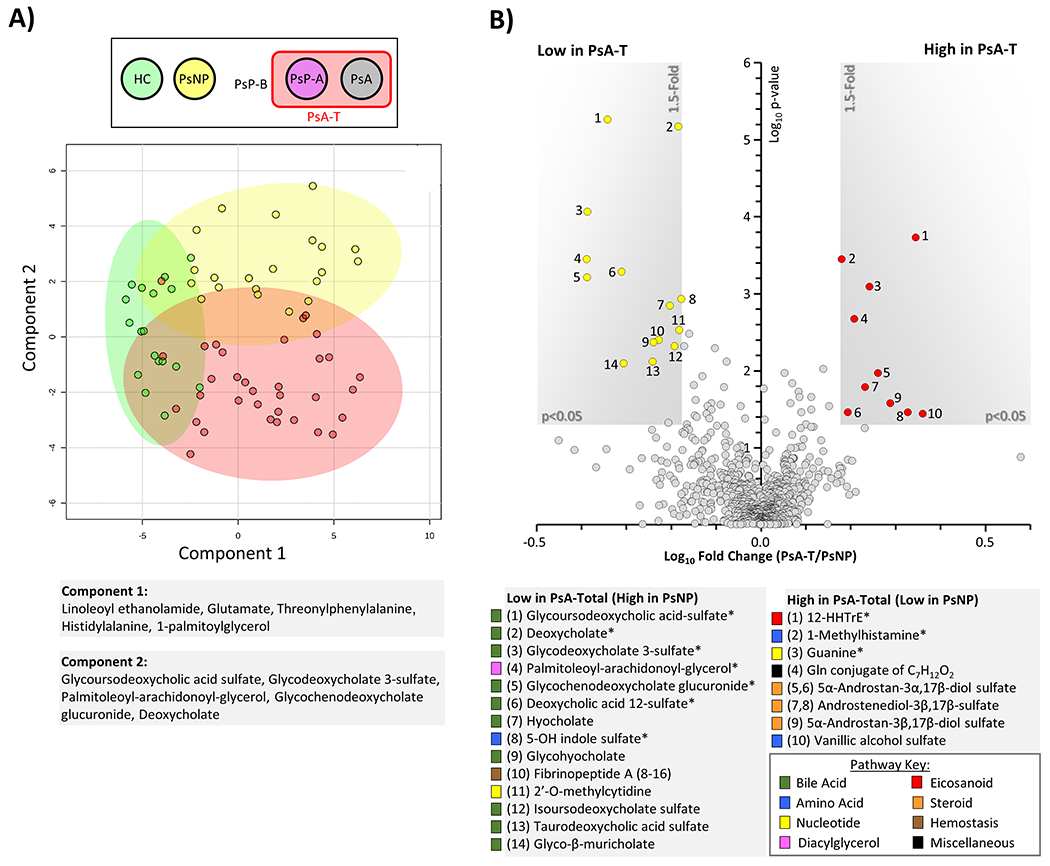
Figure 2. Metabolomic differences between healthy control, psoriasis and psoriatic-arthritis patients.

(A): Sparse partial least squares discriminant analysis (sPLDSA) between healthy controls (HC, green), Ps non-progressors (PsNP, yellow), and PsA-total (PsA-T, red) patients. sPLSDA plot from MetaboAnalyst 5 software is shown, with shaded areas representing 95% confidence intervals for each group. Alongside axes are shown the top 5 loadings for each principal component. (B): Volcano plot comparison between PsA-T and PsNP. X-axis shows Log10 of fold change. Y-axis shows −Log10 of p-value (Mann-Whitney U test). Metabolites achieving both statistical significance (p<0.05) and greater than 1.5-fold difference between groups, are shown inside the shaded gray areas, and identified with numbers (see legend below plot). The relevant pathways for individual metabolites are color-coded (see pathway key). Data are means from 21 PsNP and 34 PsA-T individuals. Metabolites marked with an asterisk (*) are significant after FDR correction (Storey q value <0.05).
