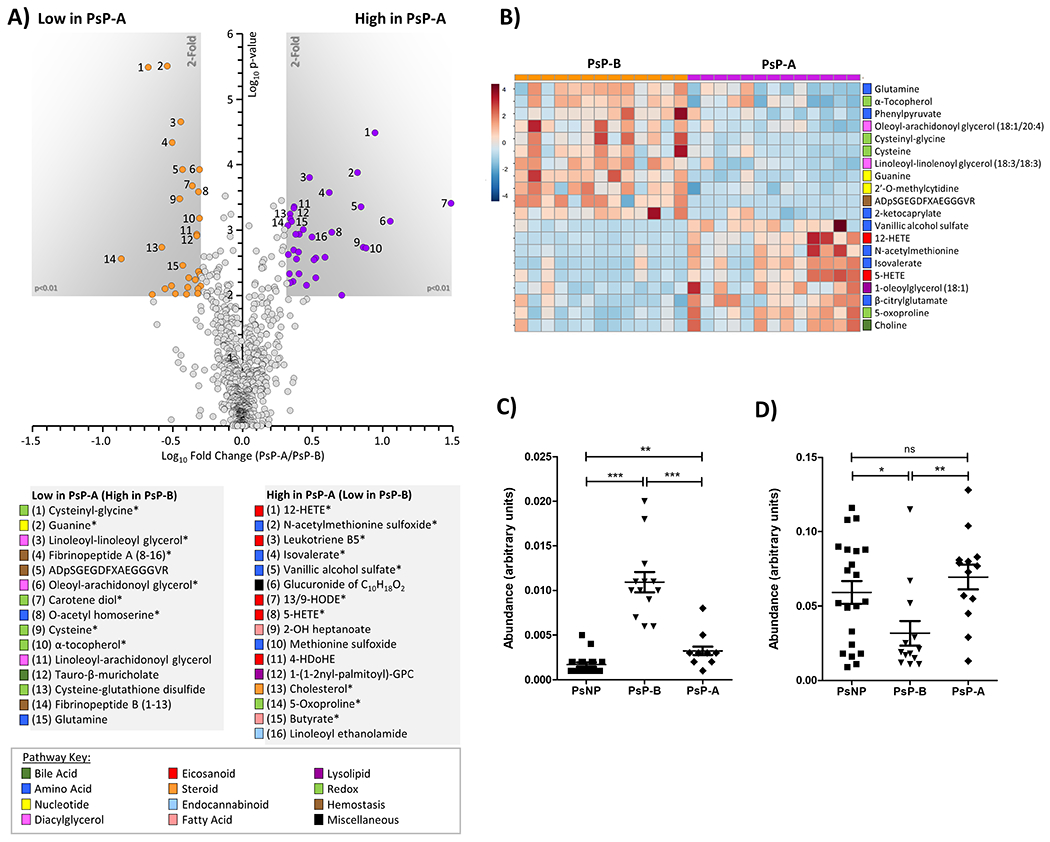
Figure 6. Metabolomic differences during longitudinal progression from Ps to PsA.

(A): Volcano plot comparing metabolites between PsP-B and PsP-A patients. X-axis shows Log10 of fold change. Y-axis shows −Log10 of p-value (Mann-Whitney U-test). Metabolites achieving both statistical significance (p<0.01) and greater than 1.5-fold difference between groups, are shown inside the shaded gray areas, and identified with numbers (see legend below plot). Data are means from 13 individuals. Metabolites marked with an asterisk (*) are significant after FDR correction (Storey q value <0.01). The relevant pathways for individual metabolites are color-coded (see pathway key). (B): Cluster heat map (MetaboAnalyst 5.0, Euclidean/Ward algorithm) showing top 20 altered metabolites by t-test achieving p<0.05. The relevant pathways for individual metabolites are color-coded (see pathway key). (C and D): Serum guanine (C) and butyrate (D) levels were compared between samples from 13 PsP and 21 PsNP and normalized data presented as a dot plot. ‘***’ indicates p-value less than 0.0001 and ‘*’ indicates p-value less than 0.01.
