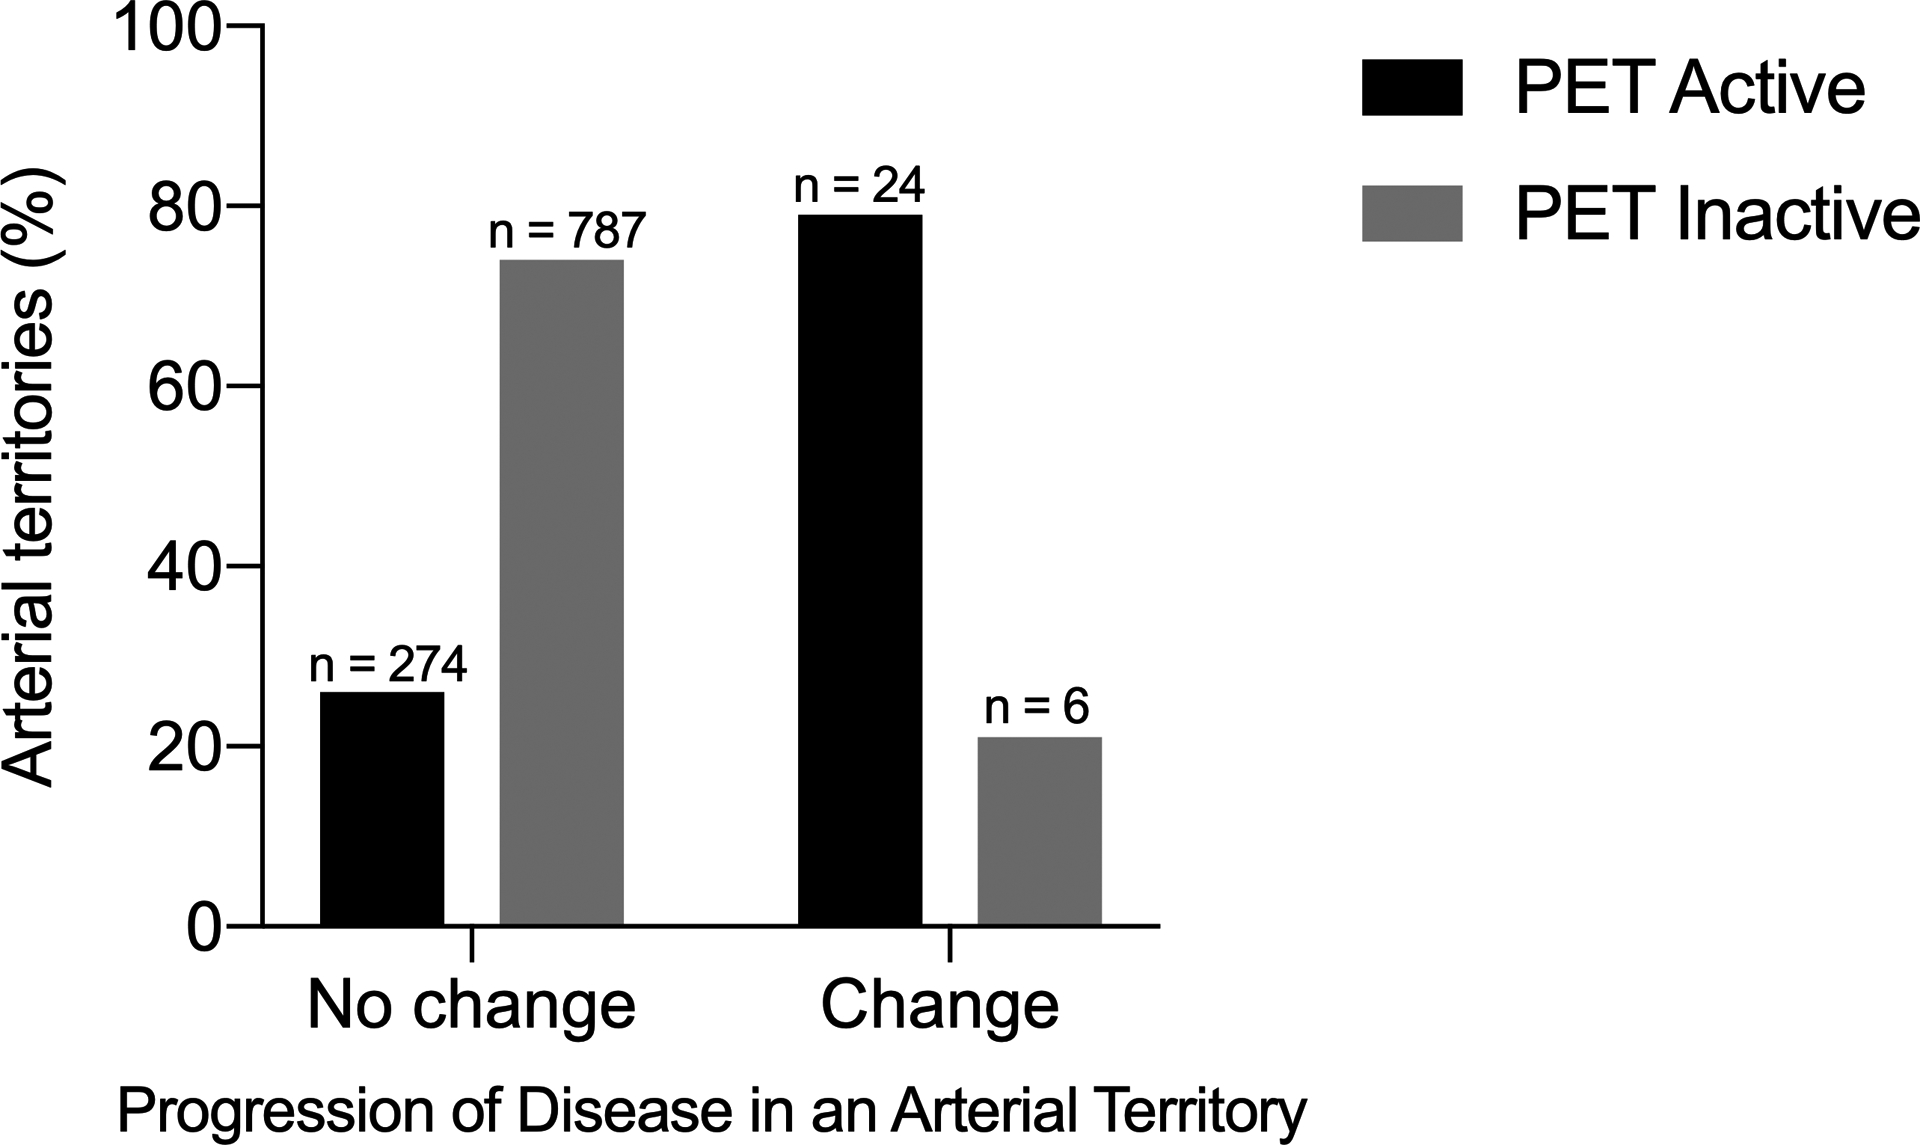
FIGURE 2: Assessment of Angiographic Progression of Disease in Arterial Territories With and Without FDG-PET Activity.

Arterial territories were divided into those that did versus did not change on follow-up angiogram. The presence (black bars) or absence (gray bars) of FDG-PET activity was evaluated in each arterial territory.
