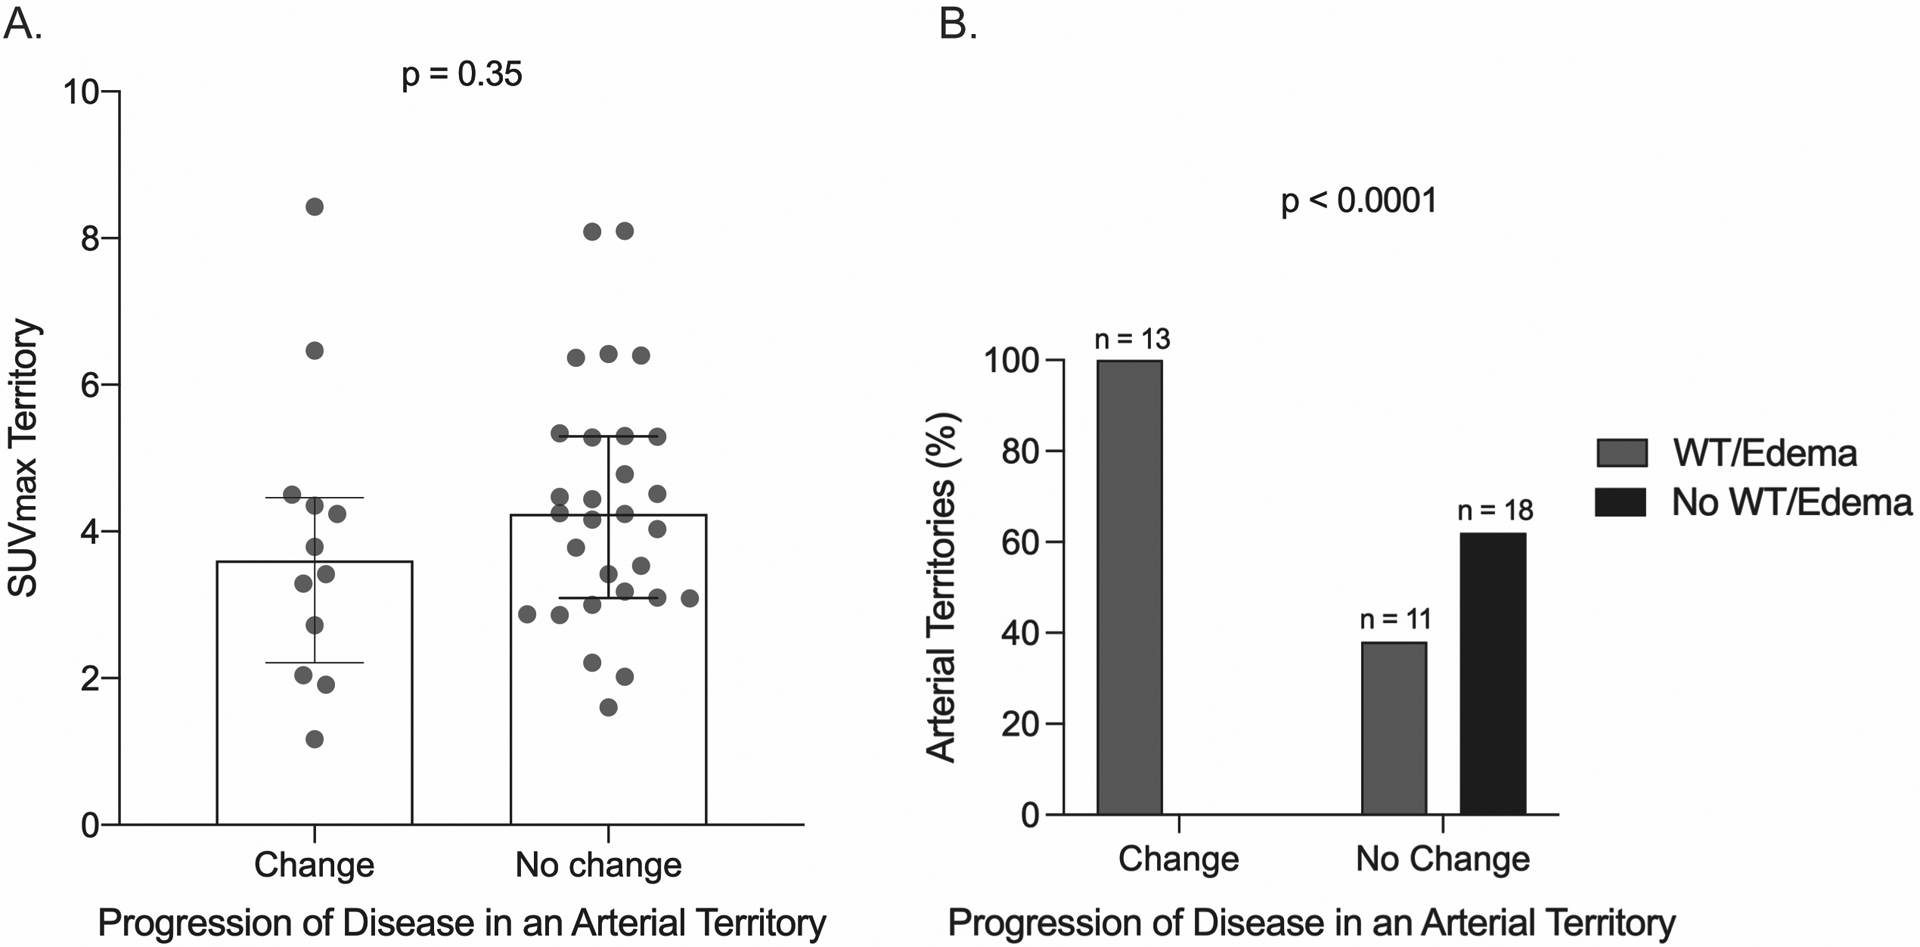
FIGURE 4: Imaging Characteristics Associated With Angiographic Change.

A. SUVmax values on baseline FDG-PET scan were assessed among territories with asymmetric FDG-PET activity that did versus did not develop angiographic progression of disease over follow-up. B. Corresponding wall morphologic changes (i.e. wall thickening and edema) on baseline angiography were assessed among territories with asymmetric FDG-PET activity that did versus did not develop angiographic progression of disease over the follow-up interval. SUVmax=maximum standardized uptake values; WT=wall thickening.
