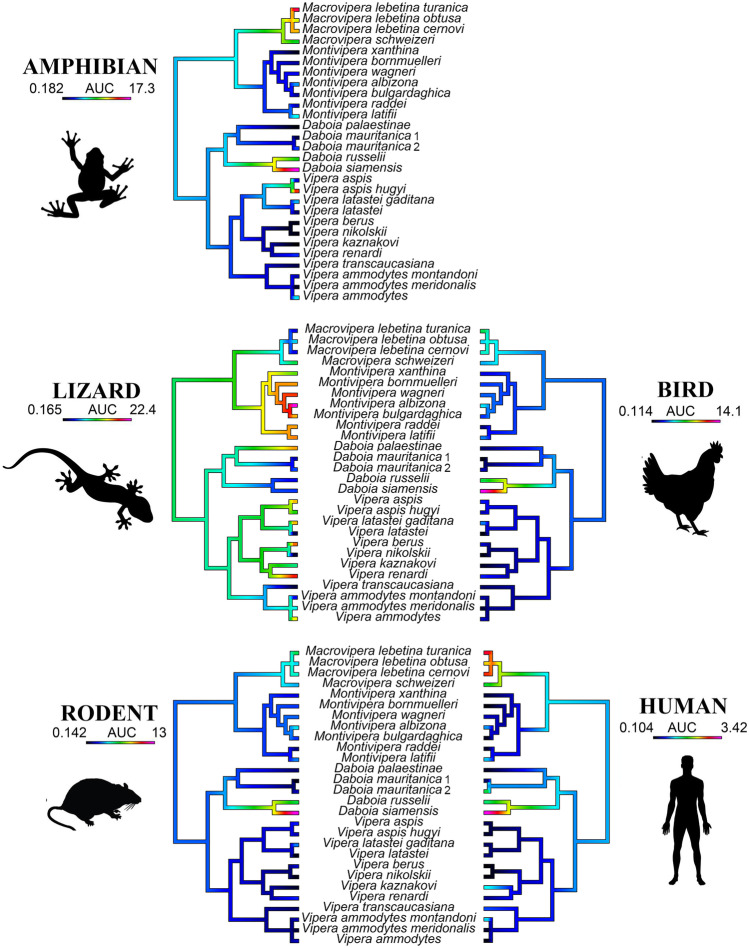
Fig. 2.
Ancestral reconstruction of relative neurtoxicity mapped over the Paleactic viperid snake organismal tree. Warmer colors correspond to higher AUC values (greater potency) while cooler colors correspond to lower AUC values (lesser potency). Note that each target organism is scaled for relative effect within that organism, not for relative effect between organisms. Thus, overall potency varies between organisms, with lizard the most strongly bound and human the least. See Fig. 1 for graphing of potency using the same scale for all targets and see Table 1 for values for each species/mimotope combination. Phylogeny based upon Freitas et al. (2020)

