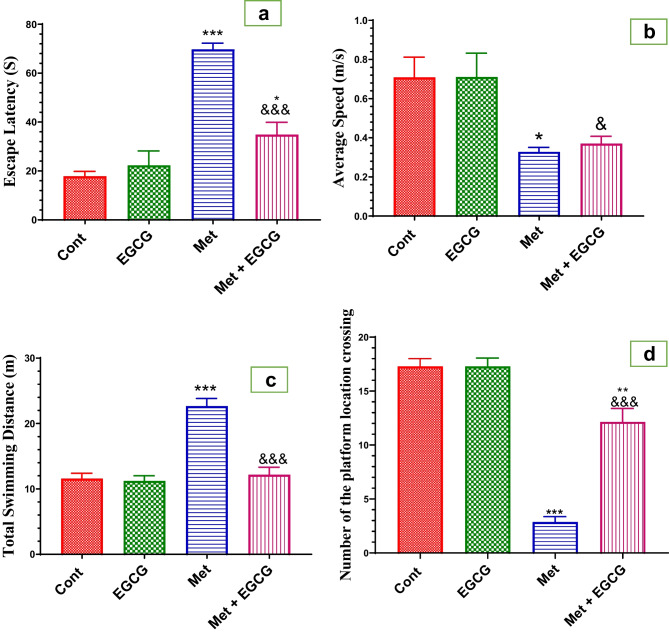
Fig. 1.
Effect Met and EGCG on escape latency (s; a), average speed (m/s; b), total swimming distance (m; c), and number of platform location crossings (d) in different mouse groups. Data are shown as mean ± SEM (n = 7). A single asterisk and ampersand (*, &) indicates significance at P < 0.05, and triple asterisks and ampersands (***, &&&) indicate significance at P < 0.001. A single asterisk and triple ampersands (*, ***) indicate comparisons with respect to the control group. A single asterisk and triple asterisks (&, &&&) indicate comparisons with respect to the methionine group. Cont, control; EGCG, epigallocatechin-3-gallate; Met, methionine; Met + EGCG, methionine + epigallocatechin-3-gallate

