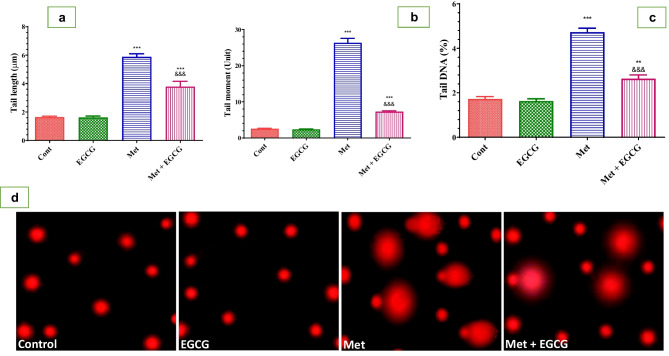
Fig. 7.
Effect of Met and EGCG on DNA damage in the brain of different experimental groups by using comet assay represented by tail length (μm; a), tail moment (unit; b), and tail DNA (%; c). (d) Representative photomicrographs of comet assay showing the effect of Met and EGCG on DNA migration in different mouse groups. Data are shown as mean ± SEM (n = 5). Double asterisks (**) indicate significance at P < 0.01 and triple asterisks and triple ampersands (***, &&&) indicate significance at P < 0.001. Double asterisks and triple asterisks (**, ***) indicate comparisons with respect to the control group. Triple ampersands (&&&) indicate comparisons with respect to the methionine group. Cont, control; EGCG, epigallocatechin-3-gallate; Met, methionine; Met + EGCG, methionine + epigallocatechin-3-gallate

