FIGURE 2.
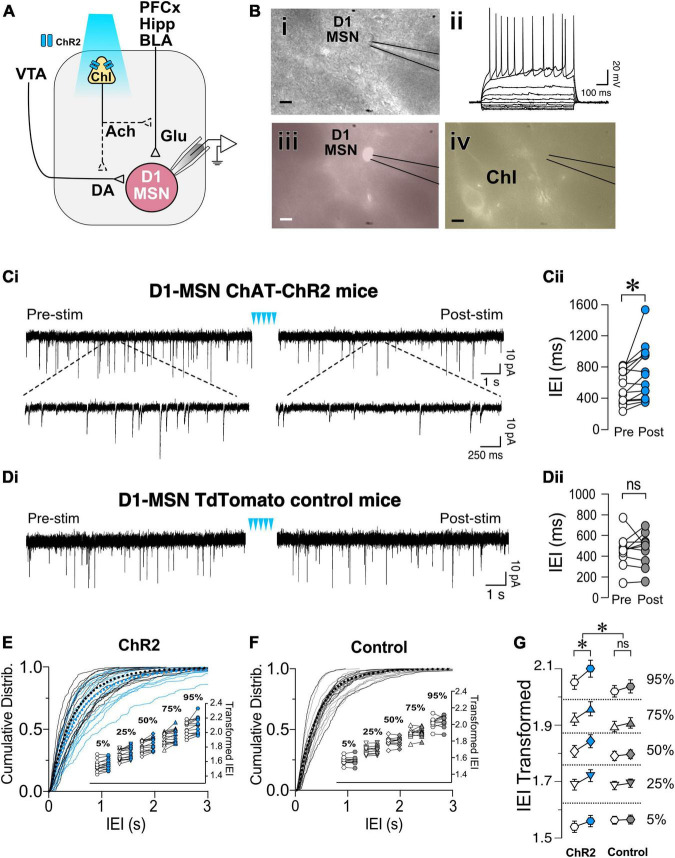
Optogenetic stimulation of ChIs decreases sEPSCs frequency in D1-MSNs. (A) Schematic of the experimental setup: whole cell recording of D1-MSNs sEPSC during optogenetic stimulation of ChIs. (B) Same slice images of representative MSNs [(i), DIC], corresponding IV traces to confirm MSN identity (ii), red-epifluorescence to verify the cell is D1R+ (iii), and eYFP epifluorescence of ChI cell in proximity of the recording (iv). Scale bar 10 um. (Ci) Representative sEPSCs in D1-MSNs in ChAT-ChR2 mice before (Pre) and after (Post) ChI optogenetic stimulation (blue arrowheads). (Cii) Average sEPSCs inter-event intervals (IEI) in Pre (white circles) and Post (blue circles) ChI optogenetic stimulation in ChAT-ChR2 D1-MSNs (n = 14). (Di) Representative traces of sEPSCs in D1-MSNs of tdTomato control mice before (Pre) and after (Post) ChI stimulation. (Dii) Average EPSCs inter-event intervals (IEI) in Pre (white circles) and Post (gray circles) ChI optogenetic stimulation in control tdTomato D1-MSNs (n = 10). (E) Cumulative frequency distribution of D1-MSN sEPSCs IEI in ChAT-ChR2 mice group Pre (black traces) and Post (blue traces) ChI optogenetic stimulation. Each solid line represents a neuron. Average traces for Pre and Post conditions are shown in dotted black and blues lines, respectively. Inset. Cumulative distributions of ChAT-ChR2 D1-MSNs EPSCs IEIs broken into percentiles of distribution to quantify median (50%), shoulders (25 and 75%), and extreme values (5 and 94%) of distribution, that are 110 transformed to normalize the distribution. (F) Cumulative frequency distribution of D1-MSNs inter-event intervals (IEI) of sEPSCs before (Pre, black lines) and after (Post, gray lines) ChI optogenetic stimulation in tdTomato control mice. Each solid line represents a neuron. Average traces are shown in dotted black and blues lines for Pre and Post conditions, respectively. Inset. Same as inset in panel (E), but in tdTomato D1-MSN controls. (G) Percentiles of cumulative distribution of transformed IEIs of EPSCs in ChAT-ChR2 D1-MSNs (Pre, white circles, Post, blue circles) and control TdTomato D1-MSNs (Pre, white circles, Post, gray circles). *p < 0.05, ns, no significant difference.

