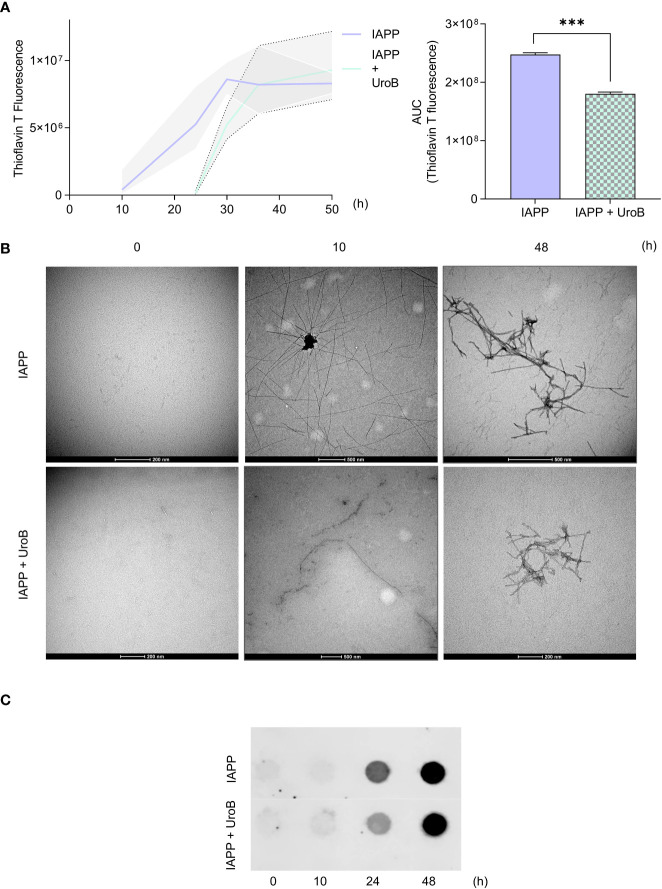
Figure 2.
Urolithin B alters the size and structure of IAPP aggregates in cell free system. (A) Thioflavin T (ThT) staining of 20 µM pure IAPP protein aggregation with or without 50 µM urolithin B (UroB) shows different aggregation patterns (left panel). Area under the curve of ThT curves (right panel). The values represent mean ± SD from at least three independent experiments. Statistical differences are denoted as *** p < 0.001 vs. the control condition. (B) Transmission Electron Microscopy of pure IAPP aggregated in the presence or absence of UroB. (C) Filter trap assay of samples taken from IAPP aggregation at the indicated time points. Representative images are shown.

