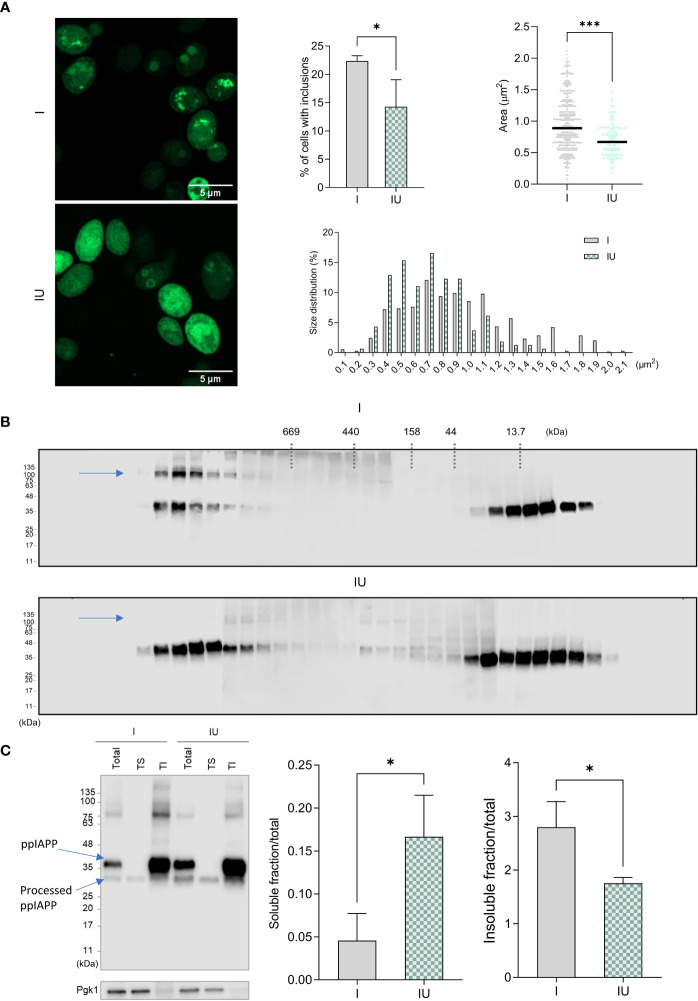
Figure 3.
Urolithin B changes the size and the chemical properties of IAPP aggregates in a cellular milieu.(A) Confocal microscopy of yeast cells expressing ppIAPP in the presence or absence of 50 µM urolithin B (UroB) indicating the number of cells with inclusions (upper left panel), the area of the inclusions (upper right panel), and their distribution in size (lower panel). (B) Size Exclusion Chromatography of protein extracts from cells expressing ppIAPP with or without 50 µM urolithin (C) Separation of protein extract according to their solubility in Triton X-100. The values represent mean ± SD from at least three independent experiments. Statistical differences are denoted as * p < 0.05 vs. the control condition. I, cells expressing ppIAPP; IU, cells expressing ppIAPP incubated with UroB. TS, Triton soluble fraction. TI, Triton insoluble fraction. Pgk1, Phosphoglycerate kinase 1. Representative images are shown. Statistical differences are denoted as *p < 0.05, ***p < 0.001 vs. the control condition.

