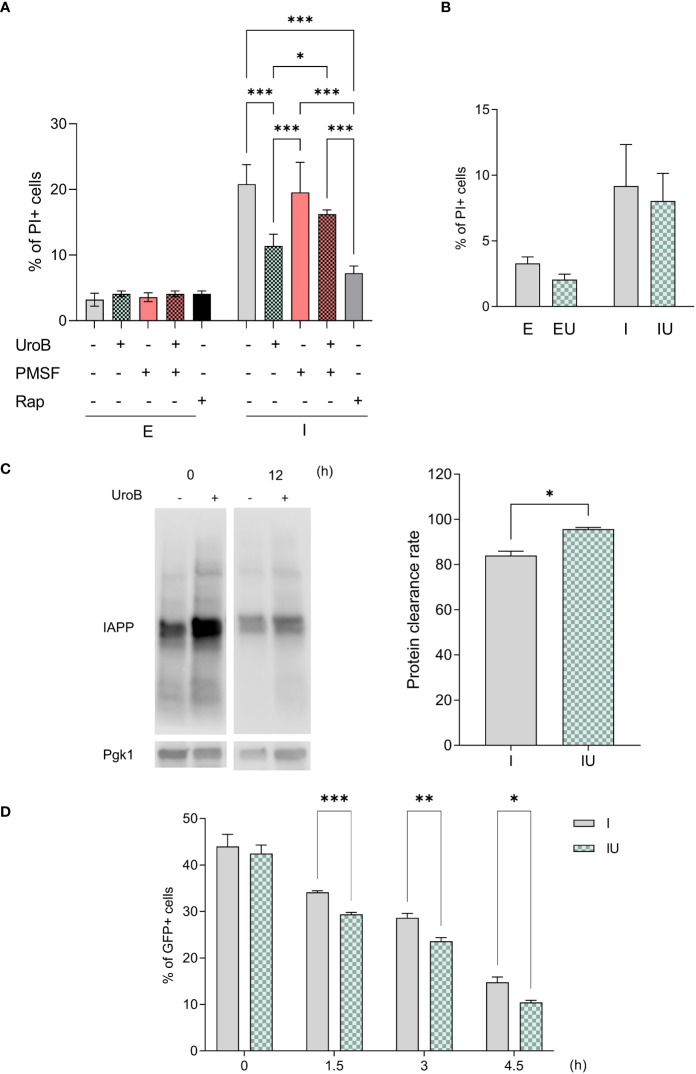
Figure 5.
Autophagy and protein clearance contribute to urolithin B-mediated protection. (A) The frequency of propidium iodide (PI) positive cells assessed by flow cytometry in cells expressing ppIAPP and the respective control in the presence of 50 µM urolithin B (UroB), the autophagy blocker phenylmethylsulfonyl fluoride (PMSF), or the autophagy inducer rapamycin (Rap); and (B) in cells lacking the ATG8 gene. (C) Protein clearance as assessed by immunoblotting. (D) The frequency of GFP positive cells by means of flow cytometry at the indicated time points after protein expression blockage. The values represent mean ± SD from at least three independent experiments. Statistical differences are denoted as ** p < 0.01, and *** p < 0.001 vs. the control condition. E, cells containing the empty vector; I, cells expressing ppIAPP; EU, cells containing the empty vector incubated with UroB; IU, cells expressing ppIAPP incubated with UroB; Pgk1, Phosphoglycerate kinase 1. Statistical differences are denoted as *p < 0.05, **p < 0.01, and ***p < 0.001 vs. the control condition.

