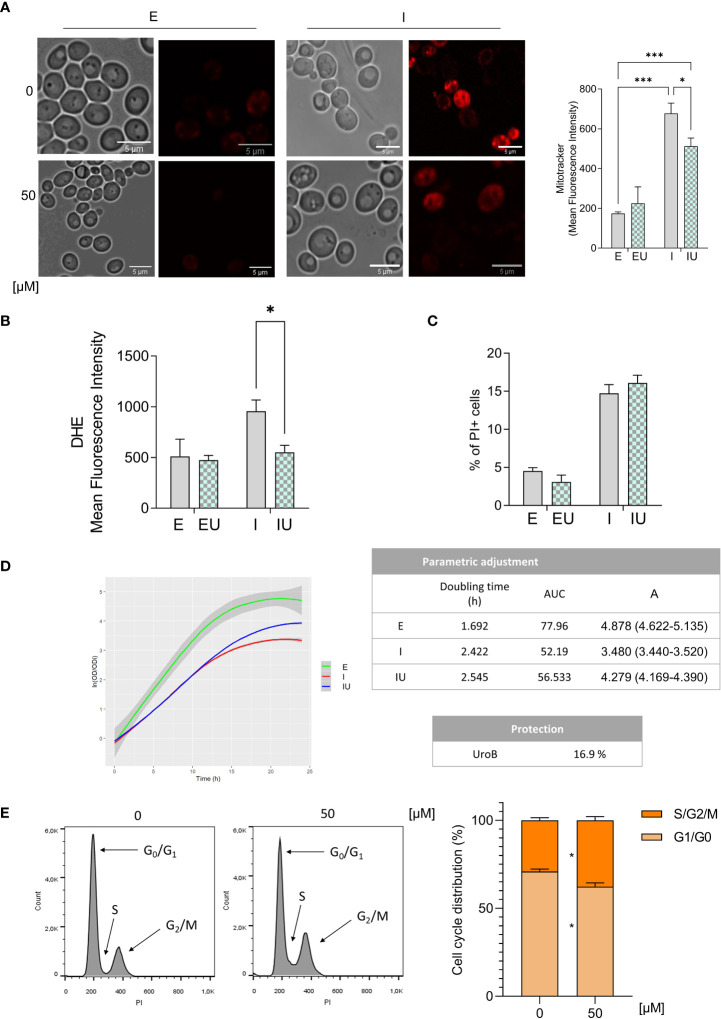
Figure 6.
Mitochondrial function, oxidative stress and growth rate are affected by urolithin B treatment.(A) Confocal microscopy images of cells expressing ppIAPP and the respective control in the presence of 50 µM urolithin B stained with Mitotracker Dye (left panel). Mean Fluorescence Intensity of Mitotracker dye was assessed by flow cytometry in cells expressing ppIAPP and the respective control (right panel). (B) Mean Fluorescence Intensity of dihydroethidium (DHE) was assessed by flow cytometry in cells expressing ppIAPP and the respective control in the presence of urolithin (C) The frequency of PI positive cells was assessed by flow cytometry in cells lacking the yap1 gene and expressing ppIAPP, and the respective control in the presence of 50 µM urolithin (D) Growth curve of cells expressing ppIAPP in the presence of 50 µM urolithin B and the respective control measured by OD600 during 24 h (left panel). Parametric adjustments of the growth curves and calculated protection (right panel). (E) Cell cycle analysis through PI staining through flow cytometry in cells expressing ppIAPP in the presence of 50 µM urolithin B (left panel). Quantitative measurement of relative cell cycle phase (right panel). The values represent mean ± SD from at least three independent experiments. Statistical differences are denoted as *** p < 0.001 vs. the control condition. UroB – Urolithin (B) PI, propidium iodide; E, cells with the empty vector; I, cells expressing ppIAPP; IU, cells expressing ppIAPP incubated with UroB. Statistical differences are denoted as *p < 0.05, and ***p < 0.001 vs. the control condition.

