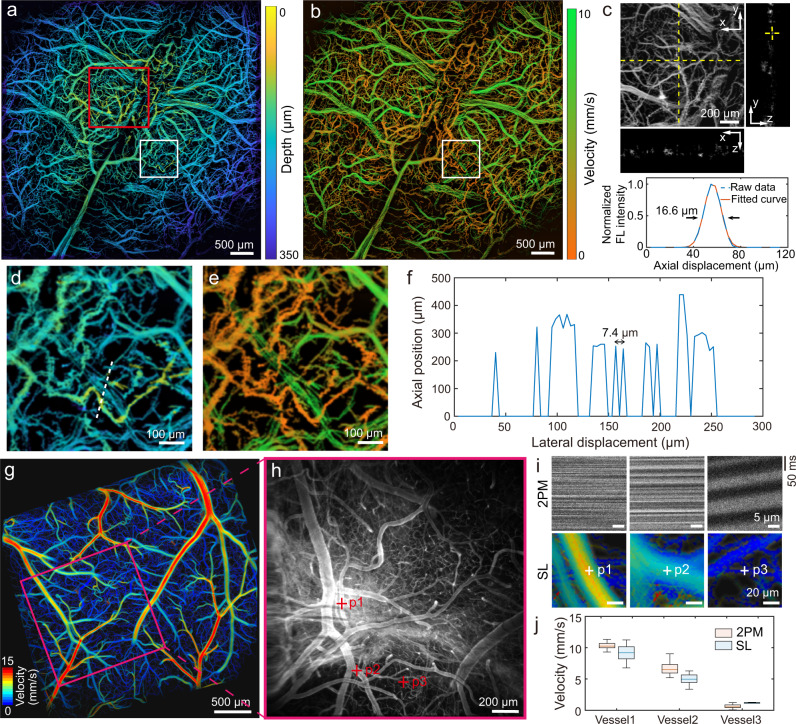
Fig. 2. Imaging of microcirculation in murine brain and skull with depth-resolved astigmatism-based sparse localization (SL) method.
a Color-encoded microvascular depth map. b The corresponding color-encoded blood velocity map. c Enlarged view of the red square ROI in a with yellow dashed line indicates where x-z and y-z cross-section views are sliced. The line profile in the z direction is plotted with raw data fitted Gaussian function at the bottom. d, e Expanded views of the white square ROIs indicated in a and b. f Signal profile along the white dashed line indicated in d. g Color-encoded velocity map of the mouse with cranial window reconstructed from SL method. h Intensity map of the purple square ROI indicated in g captured with two-photon microscopy (2PM). i Kymographs of red blood cells flow and corresponding velocity map of three selected vessels (marked with red crossings in h) captured with 2PM and SL, respectively. j Measured velocity with 2PM (n = 166) and SL method (n = 547, 526, and 8 for vessel 1, vessel 2, and vessel3, respectively) of selected vessels. In the boxplot, minima and maxima are shown as the bounds of whiskers whereas median value, 25th percentile and 75th percentile are shown as the middle, top and bottom lines of the box. Representative data from one mouse are shown.

