Figure 3.
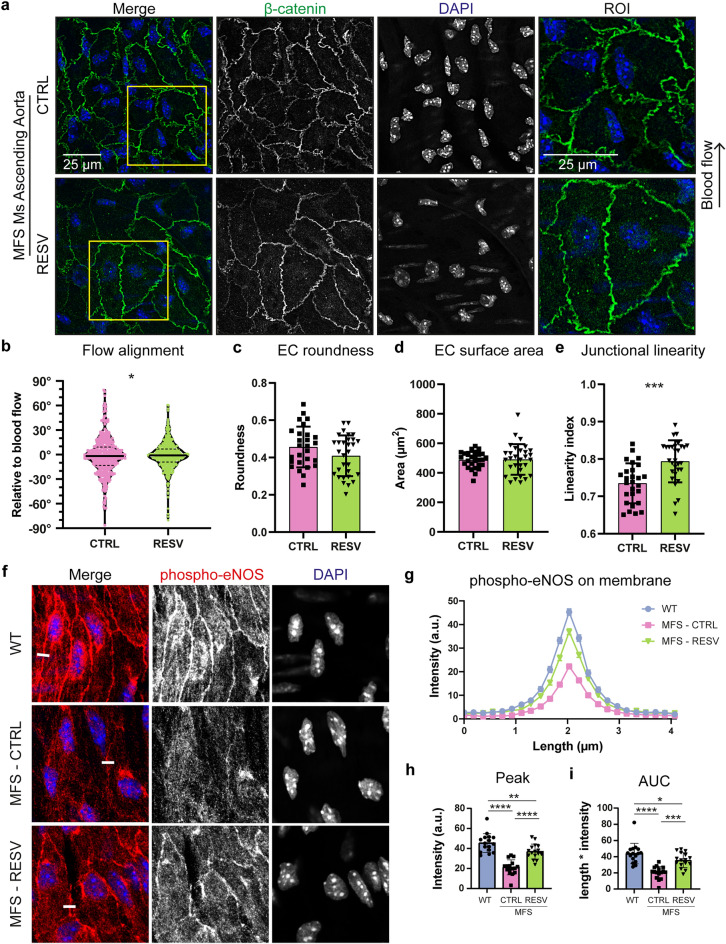
Normalization of EC morphology after resveratrol treatment in the ascending aorta in MFS mice. (a) Representative en face IF confocal images showing β-catenin (green), and DAPI (blue) of ascending aorta from 36 weeks old Fbn1C1041G/+ MFS mice treated for 3 weeks with either vehicle control or RESV. Region of interest (ROI) highlights EC junctional linearity. Arrow indicates the direction of blood flow. Scale bar: 25 μm. (b) Violin plot showing quantification of EC alignment normalized to the direction of flow. Data distribution was analyzed by Kolmogorov–Smirnov test, * indicates p < 0.05. (c–e) Bar plots of EC morphology parameters in the ascending aorta from 36 weeks old Fbn1C1041G/+ MFS mice treated for 3 weeks with either vehicle control or RESV. All data are represented as mean ± SD with indicated datapoints for vehicle treatment (N = 6; M/F 0/6) n = 24 images (total 360 ECs) and RESV treatment (N = 6; M/F 0/6) n = 24 images (total 360 ECs). (f) Representative en face IF confocal images showing p-eNOS (Ser1177) (red) and DAPI (blue) of ascending aorta from 36 weeks old WT, Fbn1C1041G/+ MFS mice treated for 3 weeks with either vehicle control or RESV. Line of quantification indicated as white line. (g) Line plot of p-eNOS quantification over a length of 4 µm perpendicular over the EC membrane in WT, MFS-CTRL, and MFS-RESV. (h, i) Bar plots comparing peak intensity and area under the curve (AUC) of p-eNOS. Data represents mean mean ± SD with indicated datapoints for WT (N = 4; M/F 0/4) n = 16 images (total 80 ECs), vehicle treatment (N = 4; M/F 0/4) n = 16 images (total 80 ECs), and RESV treatment ((N = 4; M/F 0/4) n = 16 images (total 80 ECs). *p < 0.05, **p < 0.01, ***p < 0.001, ****p < 0.0001 analyzed by students t-test or one-way ANOVA with Holm-Sidak post-test.

