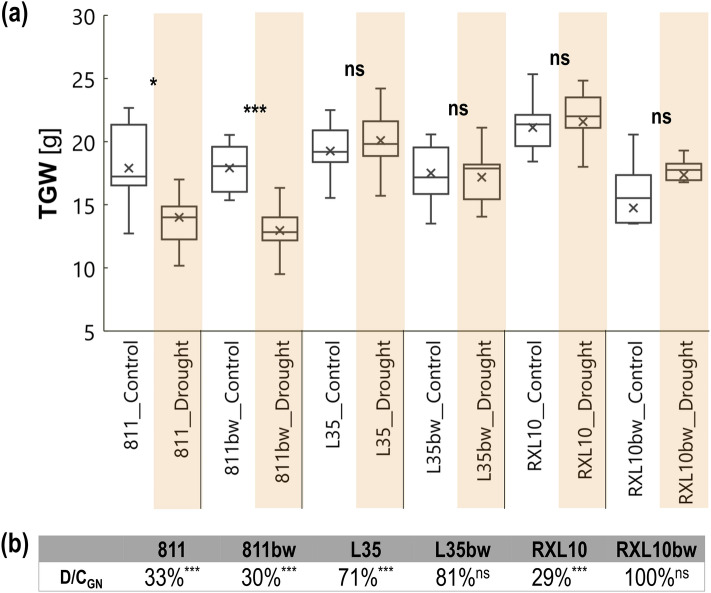
Figure 7.
Box plot (a) of leaf thousand grain weight (TGW) by glaucous (811, L35, RXL10) and non-glaucous (811bw, L35bw, RXL10bw) near-isogenic lines of rye and by soil water status (control or drought) and the drought to control percentage ratio (b) of grain number (D/CGN) in glaucous (811, L35, RXL10) and non-glaucous (811bw, L35bw, RXL10bw) near-isogenic rye lines. The statistically significant differences between the means in control and drought were verified for P ≤ 0.001(***), P ≤ 0.01(**), P ≤ 0.05(*) according to Student’s test. Ns not significant.

