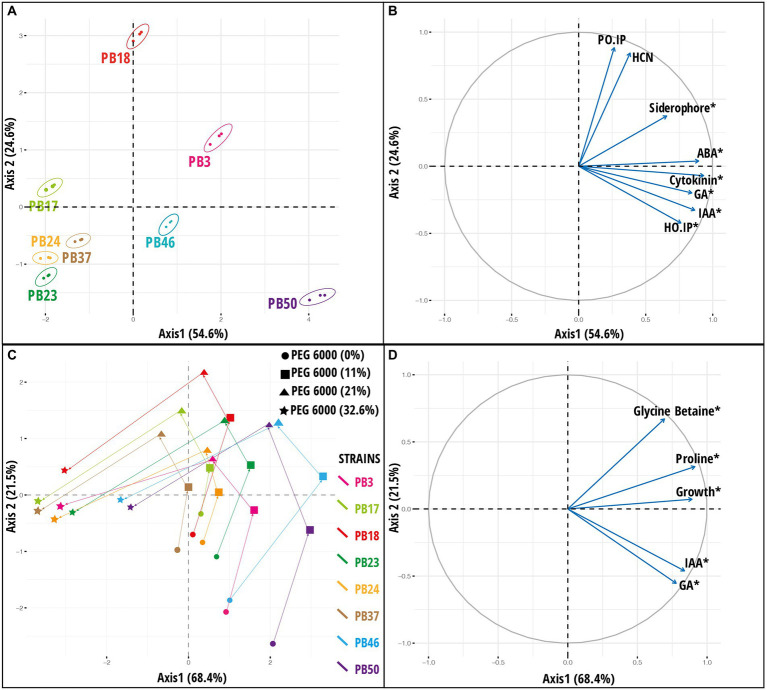
Figure 3.
Results of principal component analysis (PCA) based on the plant growth-promoting (PGP) trait data of rice phyllosphere bacteria (number of replicates, n = 3). (A) Score plot and (B) loading plot of variables according to first two principal component axes. Bacterial strains are indicated by 95% confidence ellipses. The plots correspond to 79.2% of the total data variance and variance proportions are shown along each principal component axis. (C) Score plot and (D) loading plot of variables along first two principal component axes based on microbial dataset [indoleacetic acid (IAA), gibberellic acid (GA), proline, glycine betaine, and growth] of rice phyllosphere bacterial strains measured at different PEG 6000 concentrations (number of replicates, n = 3). The plots correspond to 89.9% of the total data variance, and variance proportions are shown along each principal component axis. Variables with asterisk in plot B and D are significant along the first principal component axis. Abbreviations used in plot (B) are, abscisic acid (ABA), hydrogen cyanide (HCN), Helminthosporium oryzae inhibition percentage (HO_IP), and Pyricularia oryzae inhibition percentage (PO_IP). The codes of the strains in plots (A,C) refer to the following strains: Bacillus endophyticus PB3, B. australimaris PB17, B. pumilus PB18, B. safensis PB23, Staphylococcus sciuri PB24, B. altitudinis PB37, B. altitudinis PB46, and B. megaterium PB50.

