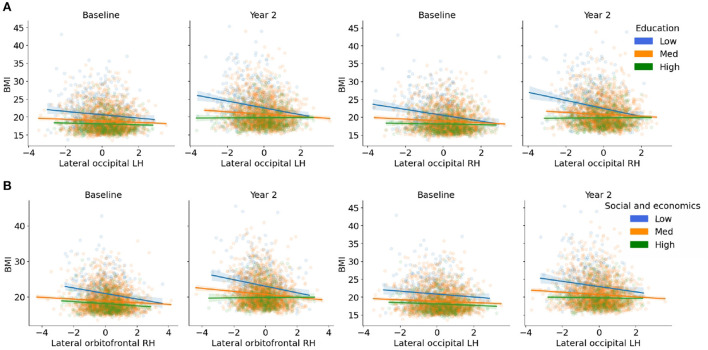
Figure 3.
(A,B) Visualization of the three-way interactions between the brain, each Child Opportunity Index (COI) domain of interest, and time (e.g., visit number [baseline, year-two follow-up]), controlling for the other two COI domains of no interest, income-to-needs, sex, puberty, race, and ethnicity. The top two Brain * COI * Time interactions are plotted for each domain. The y-axis presents the body mass index (BMI) predicted fits from the regression. (A) COIED; (B) COISE. Low (blue), medium (orange), and high (green) correspond to the values of each COI at −1 standard deviation (SD) below the mean, at the mean, and 1 SD above the mean. Fit lines indicate the regression fit with a 95% confidence interval. Individual points (i.e., subjects) are represented by the dots for each color. Lower values of each COI indicate that there were fewer resources in the area. RH, right hemisphere; LH, left hemisphere.

