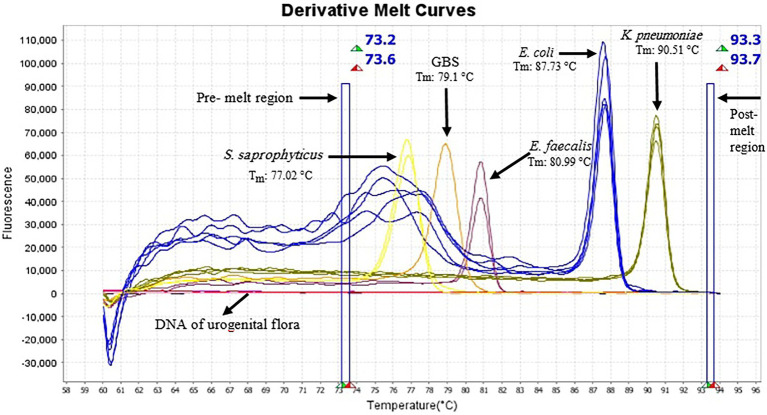
Figure 1.
Derivative melting curves of HRM analysis of five different species generated from urine samples, each displaying a unique profile with respect to shape and melting temperature. Each line represents one sample and the same colors illustrate the same pathogens. Yellow curve (S. saprophyticus, n = 2); light orange (GBS, n = 1); plum (E. faecalis, n = 2); blue (E. coli, n = 5) and dark yellow (K. pneumoniae, n = 4). Pre-melt region: The set of lines to the left of the peak displays the pre-melt start and stop temperatures when every amplicon is double-stranded. Post-melt region: The set of lines to the right of the peak displays the post-melt start and stop temperatures when every amplicon is single-stranded. The HRM analysis was performed with a pre-melt region 73.2–73.6°C and a post-melt region 93.3–93.7°C. No amplification occurred in DNA samples of urogenital flora and therefore no melting curve was observed.

