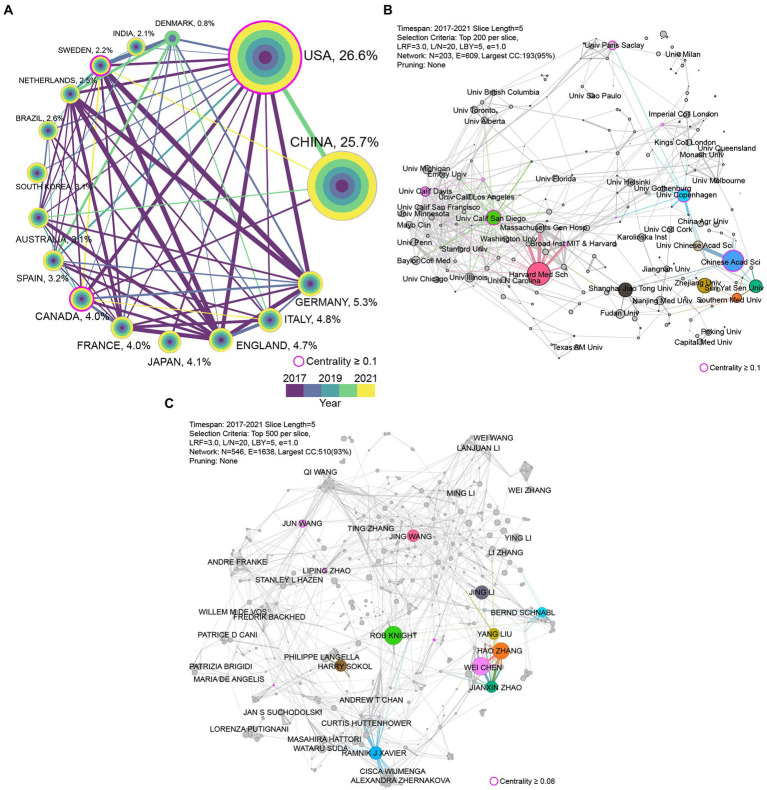
Figure 5.
The cooperation network in different levels from 2017 to 2021. (A) The cooperation network of the top 15 most productive countries. The colored rings in the node represent publications amount in different years. The lines’ thickness and color indicate the strength of cooperation relationships and the year of first cooperation, respectively. (B) The largest component of cooperation network of institutions. The top 10 institutions in the number of publications are colored. (C) The largest component of author cooperation network. The top 10 authors in the number of publications are colored. The nodes’ size and the thickness of the lines positively correlated to the production of papers and the strength of cooperation relationships, respectively.

