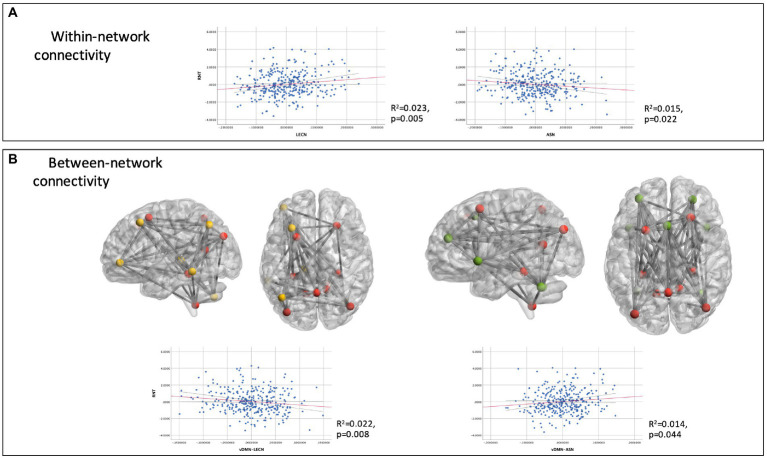
Figure 2.
Partial regression plots for within-network connectivity (A) and between-network connectivity (B) associations with RNT. Dashed lines indicate the 99% confidence intervals for the regression line. For illustrative purposes, glass brains depict connectivity between functional region of interest (ROI) of vDMN (in red) with LECN (yellow) and ASN (green).

