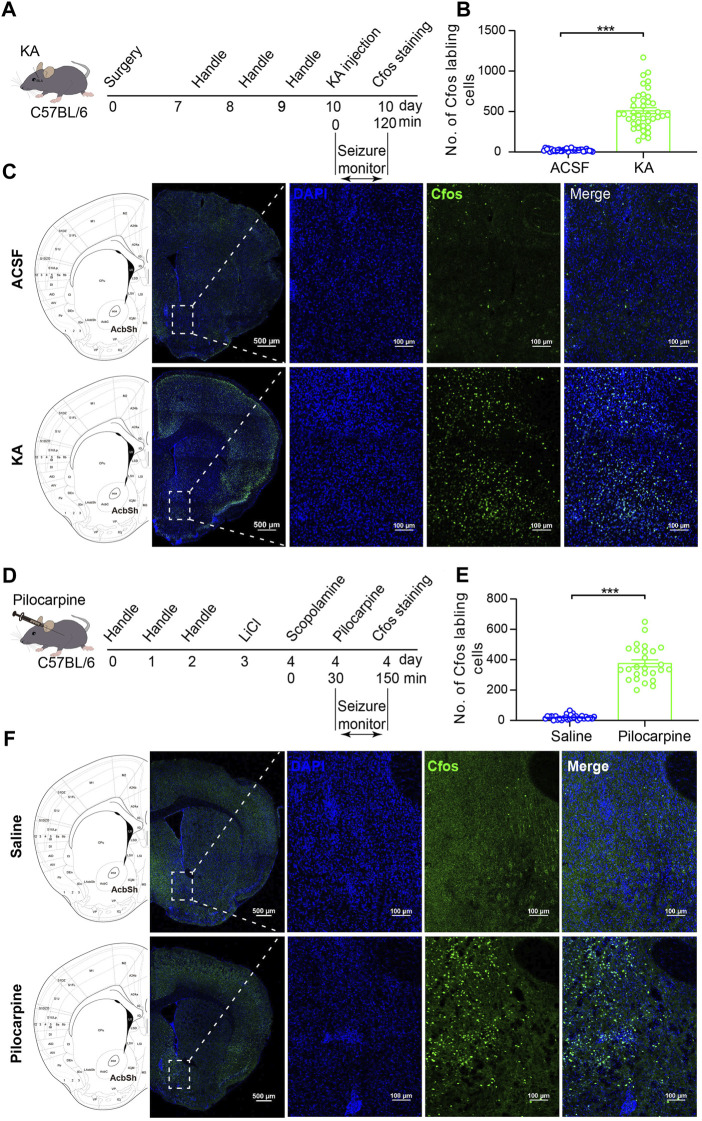
FIGURE 1.
C-fos expression in the NAc shell cells after TLE seizures. (A) Schematic diagram of TLE seizure induction on the C57BL/6 mouse by intra-basolateral amygdala (intra-amygdala) microinjection of KA. (B) Quantification of the c-fos expression in the NAc shell after seizures of the intra-amygdala KA model of TLE. ACSF group: n = 33 slices from four mice; KA group: n = 40 slices from four mice; ***p < 0.001, Student’s unpaired t test. (C) Representative confocal images showing the c-fos expression in the NAc shell after seizures of the intra-amygdala KA model of TLE. (D) Schematic diagram of mouse TLE seizure induction by i.p. Injection of LiCl–pilocarpine. (E) Quantification of the c-fos expression in the NAc shell after seizures of the systematic pilocarpine model of TLE. Saline group: n = 30 slices from four mice; pilocarpine group: n = 26 slices from three mice; ***p < 0.001, Student’s unpaired t test. (F) Representative confocal images showing the c-fos expression in the NAc shell after seizures of the systematic pilocarpine model of TLE.

